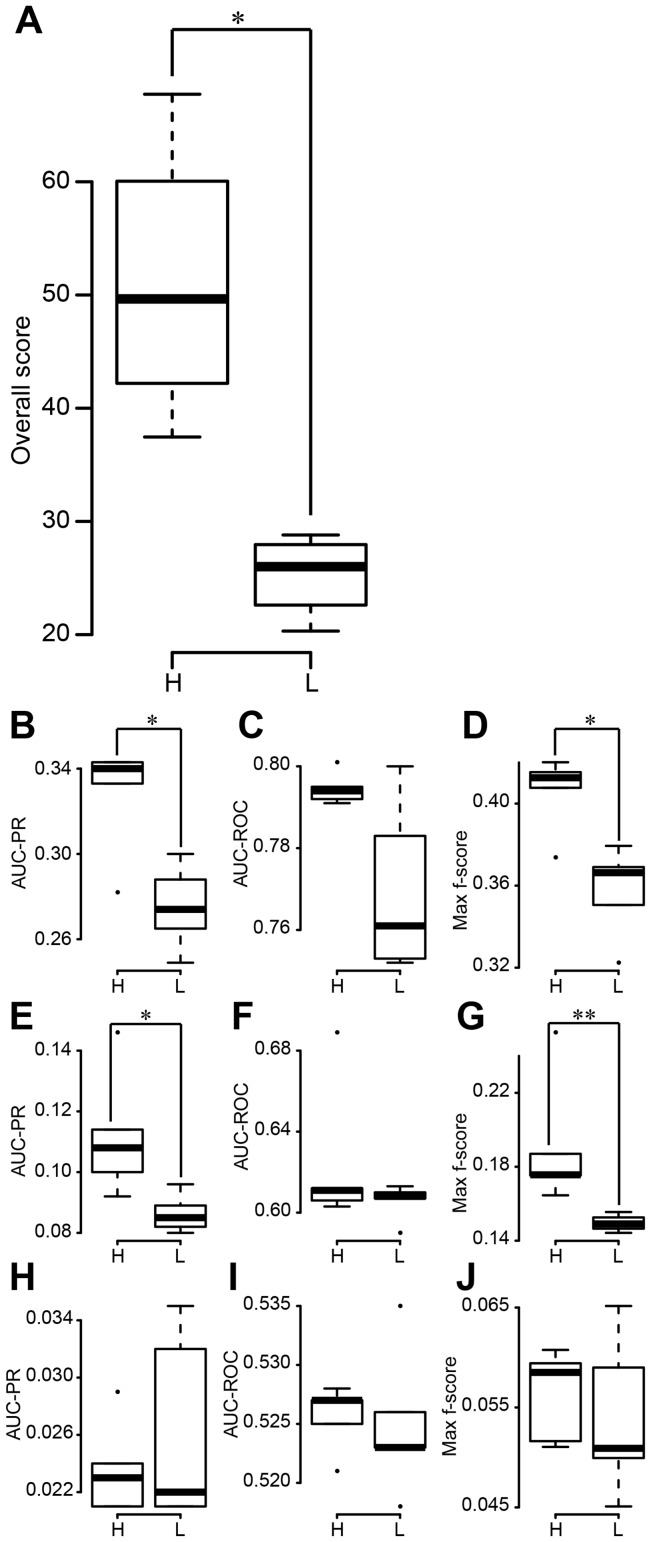
Figure 5. Performances of Top1Net based on integration of high- or low-diversity algorithm pairs by EUC distance.
H and L represent high-diversity and low-diversity algorithm pairs, respectively. (A) Box-plots of overall score. (B) Box-plots of AUC-PR for in silico dataset. (C) Box-plots of AUC-ROC for in silico dataset. (D) Box-plots of Max f-score for in silico dataset. (E) Box-plots of AUC-PR for E. coli dataset. (F) Box-plots of AUC-ROC for E. coli dataset. (G) Box-plots of Max f-score for E. coli dataset. (H) Box-plots of AUC-PR for S. cerevisiae dataset. (I) Box-plots of AUC-ROC for S. cerevisiae dataset. (J) Box-plots of max f-score for S. cerevisiae dataset. * and ** represent P<0.05 and P<0.01, by the Wilcoxon rank sum test.

