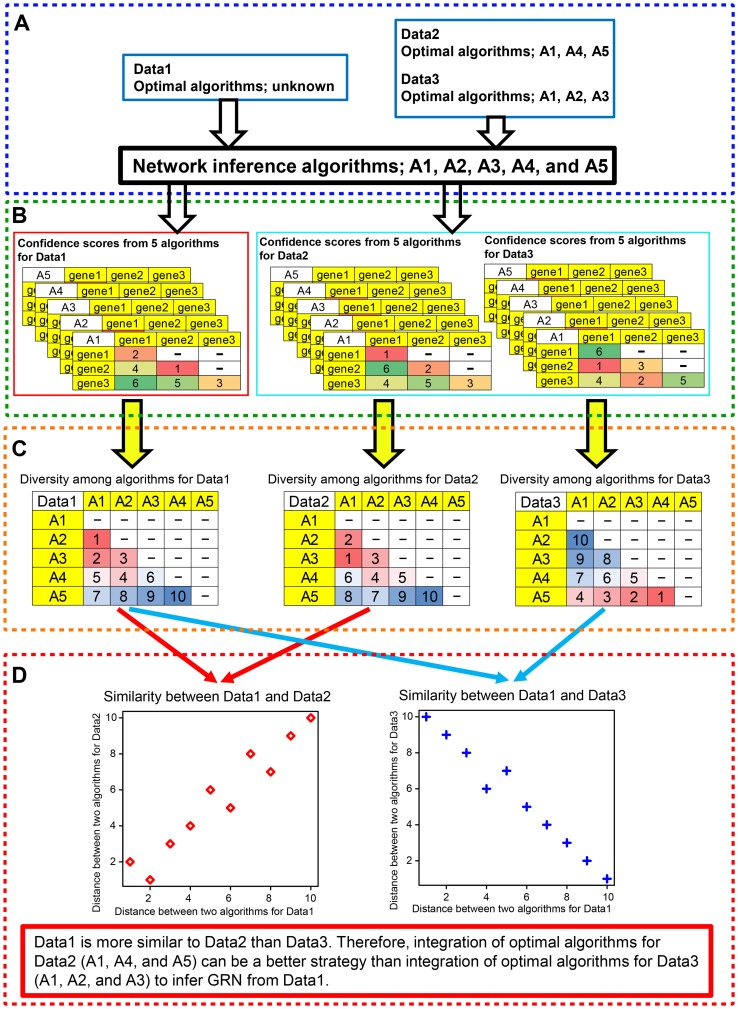
Figure 6. Overview of a method to calculate similarity between two expression datasets.
(A) Datasets. Expression datasets were split into a dataset for which optimal algorithms are unknown (e.g., Data1) and datasets for which optimal algorithms are known (e.g., Data2 and Data3). (B) Confidence scores of links between two genes. For each of datasets, confidence scores from each of algorithms (e.g., algorithms, A1, A2, A3, A4, and A5) were calculated. (C) Diversity among algorithms. By using confidence scores calculated in (B), diversity among algorithms were calculated for each of three datasets. In this example, we examined five algorithms and thus, for each of the datasets, we have a vector of 10 distances between two algorithms. (D) Similarity between two expression datasets. Correlation coefficient between the vector of algorithm distances from Data1 and that from Data2 was calculated. The calculated correlation coefficient is defined as similarity between Data1 and Data2. In the example in this figure, Data1 is more similar to Data2 than Data3. Thus, optimal algorithms for Data2 could perform better than those for Data3 to infer GRN from Data1.

