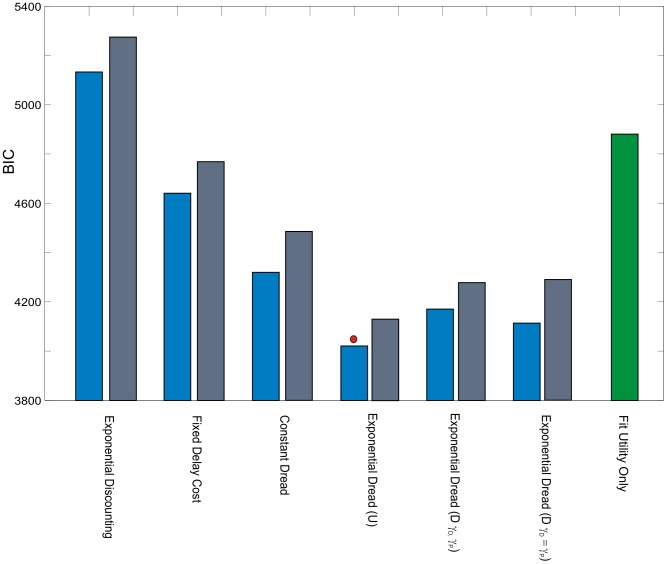
Figure 6. Model comparison with non-linear utility: Experiment 1.
The results of an identical model comparison, performed with subject-specific non-linear utility functions for pain, derived from subjective ratings of stimuli with differing shock rates, as shown in Figure S6. Blue bars represent summed  values for linear utility models, gray bars the
  values for non-linear utility models. For each alternative model using linear utility provided better model fits, as indicated by lower
  values. Importantly, the rank order of the models was largely unchanged using non-linear utility, the only exception being that the general form Exponential Dread model outperformed the Restricted Discounted version with non-linear utility, but not with linear utility. The green bar labelled “Fit Utility Only” represents the result of implementing the Null model with a freely fitted three-parameter Weibull utility function, showing that a variable utility function alone was unable to account competitively for the observed data.

