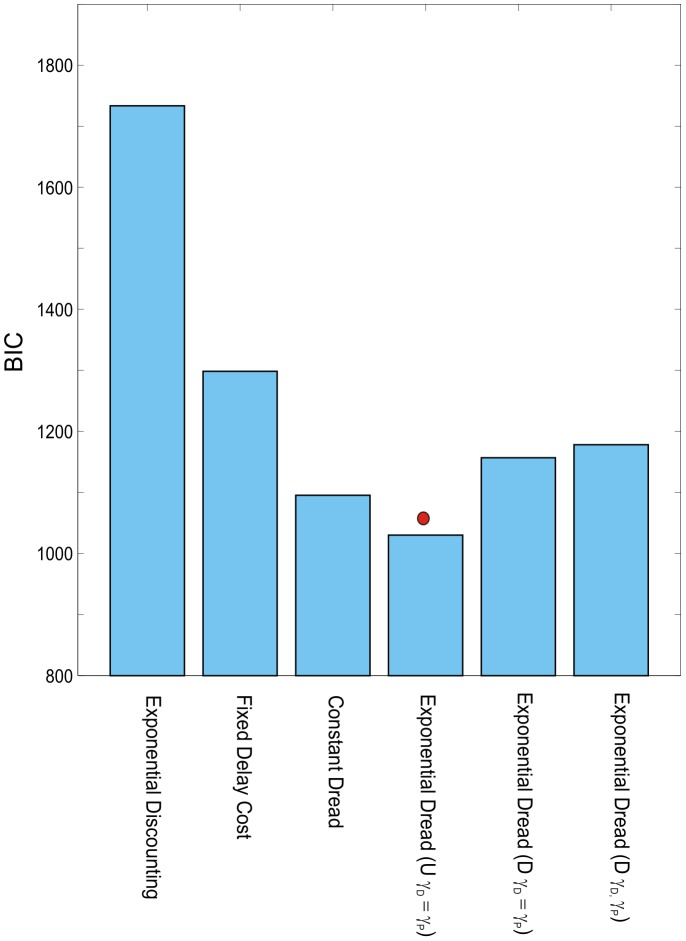
Figure 9. Model comparison for Experiment 2.
Bayesian Information Criterion ( ), summed across participants (N = 30) for the alternative models. Lower values of
  indicate better fits of the model. Undiscounted Exponential Dread provided the most parsimonious fit at the group level, indicated by the red circle.

