
Figure 7. DUX4-bound regions are similarly activated in FSHD patient myotubes and in DUX4-transduced myoblasts.
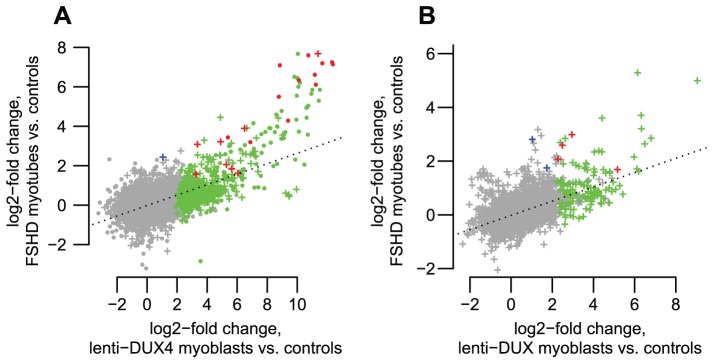
(A) DUX4-bound regions show correlated activation levels in FSHD patient myotubes and in our DUX4-transduced myoblast experimental system. We show log2-activation levels in each system, counting RNA-seq reads within an arbitrary 1 kb of DUX4-bound regions as for Figure 3A. “+” symbols show bound repetitive elements and dot symbols are unique regions. Green symbols show regions that reach statistical significance in only the DUX4-transduced myoblasts, blue symbols are significant in only the FSHD myotubes, and red symbols are significant in both comparisons. The dotted line is a regression line (slope 0.265). (B) Internal regions of ERV and MaLR repeats show correlated activation levels in FSHD patient myotubes and in our DUX4-transduced myoblast experimental system. Colors as in panel A. The dotted line is a regression line (slope 0.270).