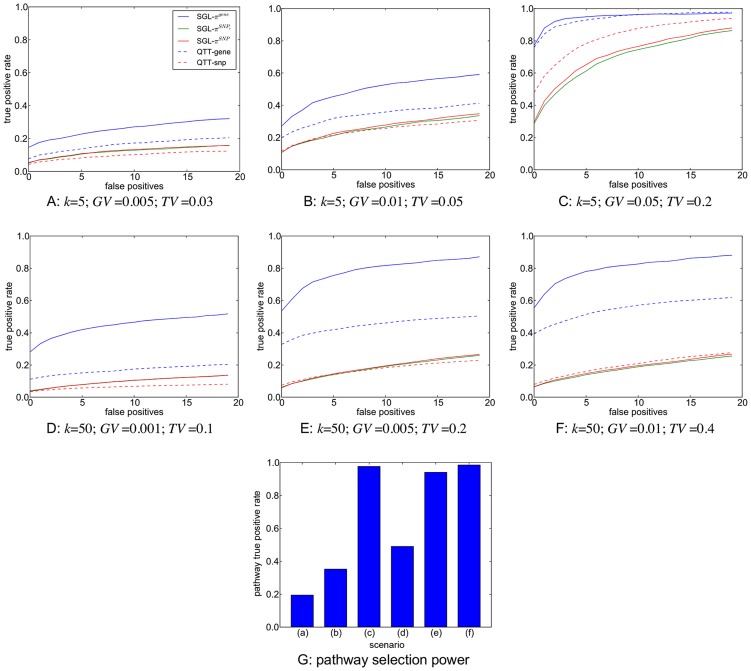
Figure 7. A–F: SNP and gene ranking performance for the six different scenarios described in Table 2.
Plots show mean true positive rates over 400 MC simulations for each scenario. Three different subsample ranking methods (solid lines) are used for SGL, as described in the previous section. SNP and gene ranking performance obtained by ranking p-values from a univariate, regression-based quantitative trait test (QTT - dashed lines) are shown for comparison. Definitions for true positive rates and number of false positives are described in the main text. G: Pathway selection performance for each scenario. True positive rates represent the proportion of simulations in which the correct causal pathway is selected.

