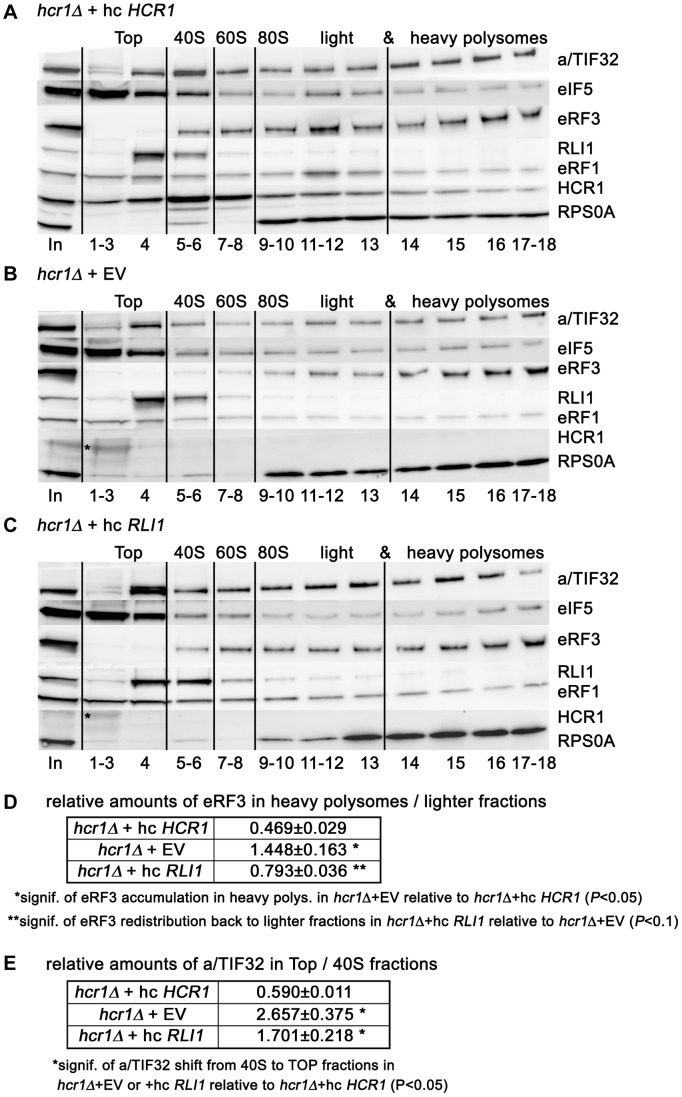
Figure 5. Deletion of hcr1 results in accumulation of eRF3 in heavy polysomes.
(A–C) The hcr1Δ strain (H3675) was transformed with either hc HCR1 (A), empty vector (B), or hc RLI1 (C), and the resulting transformants were grown in SD medium at 30°C to an OD600 of ∼1 and cross-linked with 0.5% HCHO prior to harvesting. WCEs were prepared, separated on a 5%–45% sucrose gradient by centrifugation at 39,000 rpm for 2.5 h and subjected to Western blot analysis. Several fractions corresponding to the Top, 40S, 60S, and 80S plus polysomal species were pooled, as indicated. Asterisk indicates a non-specific band. (D) Statistical significance of the eRF3 accumulation in heavy polysomes in the hcr1 strain and its partial recovery by hc RLI1. Amounts of each individual factor in all fractions were quantified by fluorescence imaging. Thus obtained values for the fractions containing heavy polysomes (14–18) as well as all remaining fractions (1–13) were added up for each of these two groups. Values (mean±SE; n = 4) given in the table then represent relative amounts of factors in heavy polysomes divided by the compound value of the rest of the gradient. Changes in the redistribution of factors between the heavy polysomes and lighter fractions in all three strain were analyzed by the student's t-test and shown to be statistically significant only for eRF3 as shown in the table. (E) Statistical significance of the eIF3 shift from 40S-containing fractions to the top, which is independent of the effect of hc RLI1 on eRF3. Essential the same as in panel D, except that the values for the Top fractions (1–4) as well as the 40S fractions (5–6) were added up for each of these two groups. Values (mean±SE; n = 4) given in the table then represent relative amounts of factors in the Top divided by the 40S group. Changes in the redistribution of factors between the 40S and Top fractions in hcr1Δ+EV or +hc RLI1 strains vs. wt were analyzed by the student's t-test and shown to be statistically significant only for eIF3 as shown in the table.

