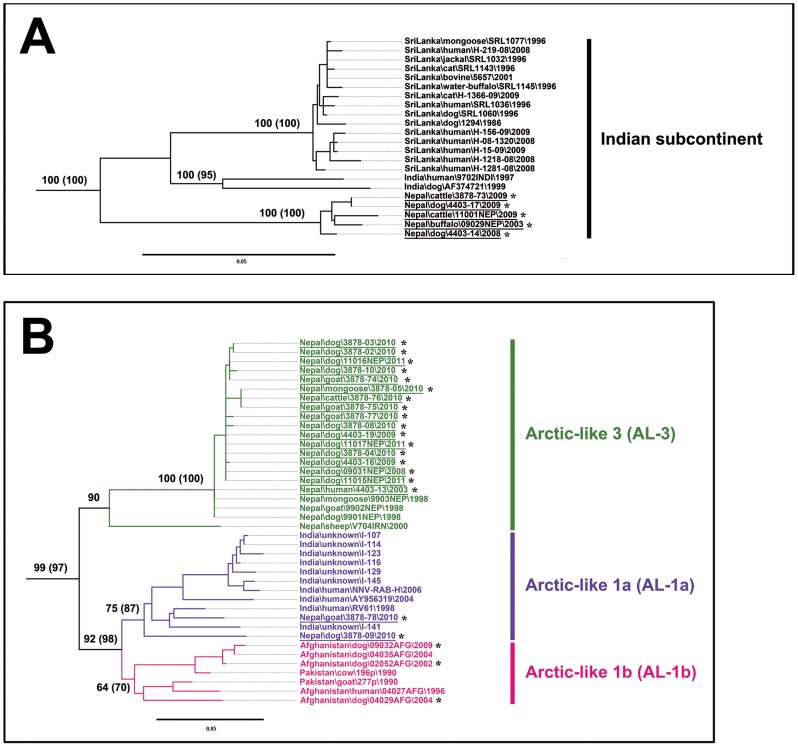
Figure 3. A: Magnified phylogeny of the Indian subcontinent clade.
B: Magnified phylogeny of the Arctic-like 1 and 3 sub-clades. Branches are labeled with bootstrap values generated with both the neighbor-joining (1,000 bootstrap replications) and maximum likelihood (100 bootstrap replications, number in brackets) algorithms. Bootstrap values are given for selected relevant nodes only. A scale indicating genetic distance is presented by the horizontal bar. Designations of the different RABV phylogroups (clade, sub-clade and lineage) are as indicated, based on previously defined assignments [5], [25]. Isolates for which the complete N gene sequence was obtained in this study are indicated by an asterisk with the viruses from Nepal underscored.

