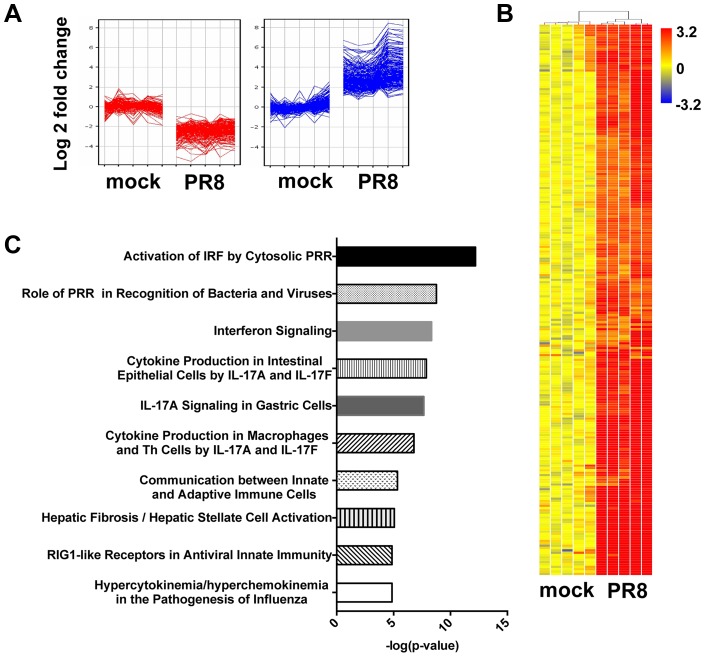
Figure 2. In primary MTEC, influenza A infection induces an IFN signature.
Total RNA from mock and PR8 infected cells was analysed using Affymetrix Mouse Genome 430 2.0 microarrays at 24(≥4-fold change relative to mock infected; t-test unpaired, p<0.01, Benjamini-Hochberg multiple test correction). (A) K-means clustering of the differentially expressed genes. (B) Heat map of the 234 upregulated-gene, as shown in (A). The range of fold changes is expressed in a log2 scale. (C) Ingenuity Pathway Analysis of the upregulated genes in influenza infected MTEC.

