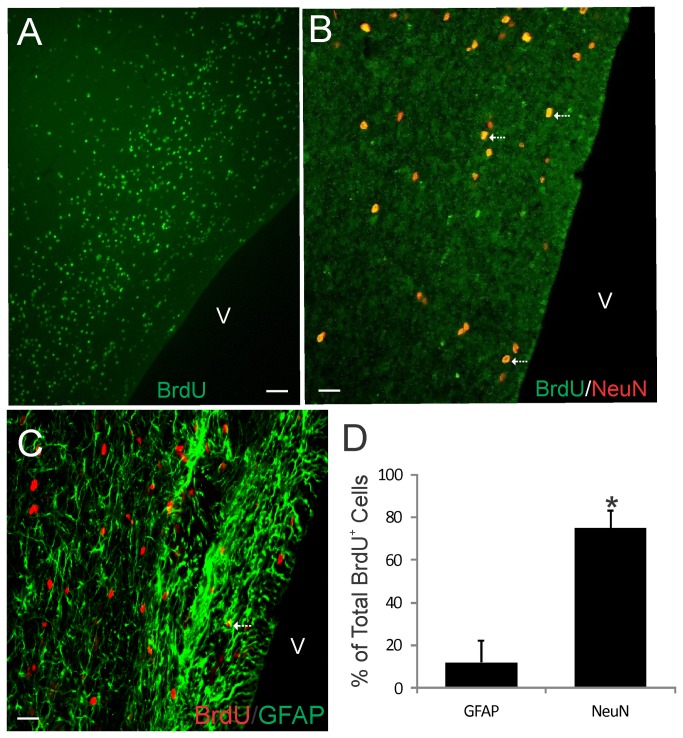
Figure 4. Bromodeoxyuridine (BrdU) cell proliferation tracking in piglet OB SVZ.
A and B. Confocal microscope images showing that the OB contains numerous BrdU+ cells (A, green) and subsets of these cells are newly born neurons as shown by the colocalization (B, seen as yellow, arrows) with the neuron marker NeuN. C. Confocal microscope images showing the co-labeling (arrows) of the DNA synthesis marker BrdU (red) and glial fibrillary acidic protein (GFAP, green) in the OB SVZ. Some BrdU+ nuclei are associated with GFAP+ cytoplasm. Scale bars = 33 µm (A), 17 µm (B), 20 µm (C). D. Graph showing the proportions of the total BrdU+ cells that are either GFAP+ or NeuN+. Values are mean ± SD (n=4). Some BrdU+ cells were not positive for either marker. Asterisk denotes NeuN significant difference (p < 0.001) compared to GFAP.

