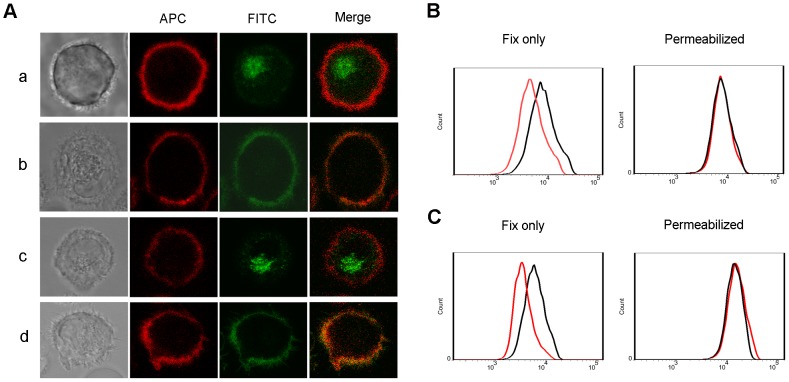
Figure 5. Internalization induced by 1-17-2 rat antibody and refined antibody.
(A) Microscopic images of 1-17-2 mAb induced internalization. Cells were stained with APC-labeled anti-CD11c (red), FITC-labeled rat or refined 1-17-2 mAb (green). Bright field images show the shape of cells. Panel a and b: rat 1-17-2 mAb cultured with DCs at 37°C or 4°C respectively. Panel c and d: refined 1-17-2 mAb cultured with DCs at 37°C and 4°C respectively. (B, C) Staining levels of rat (B) and refined (C) 1-17-2 mAb on DCs. Fix only indicates detection of mAb staining on the cell surface. Permeabilized indicates detection of mAb staining on the surface and intracellularlly. Red line: DCs incubated at 37°C; Black line: DCs incubated at 4°C.

