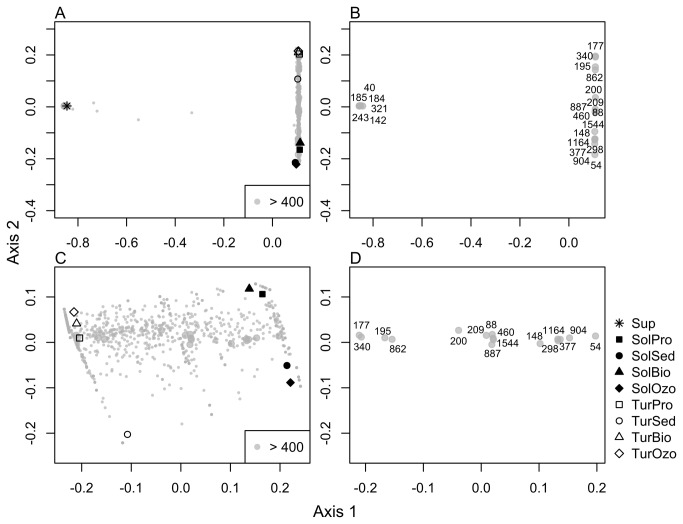
Figure 4. Ordination diagrams (PCO) of the bacterial community based on barcoded pyrosequencing data.
(A) in all sampling compartments; (B) the most abundant OTU’s associated to all sampling points; (C) only in turbot and the sole sampling compartments (without water supply); (D) the most abundant OTUs associated to turbot and the sole sampling compartments.

