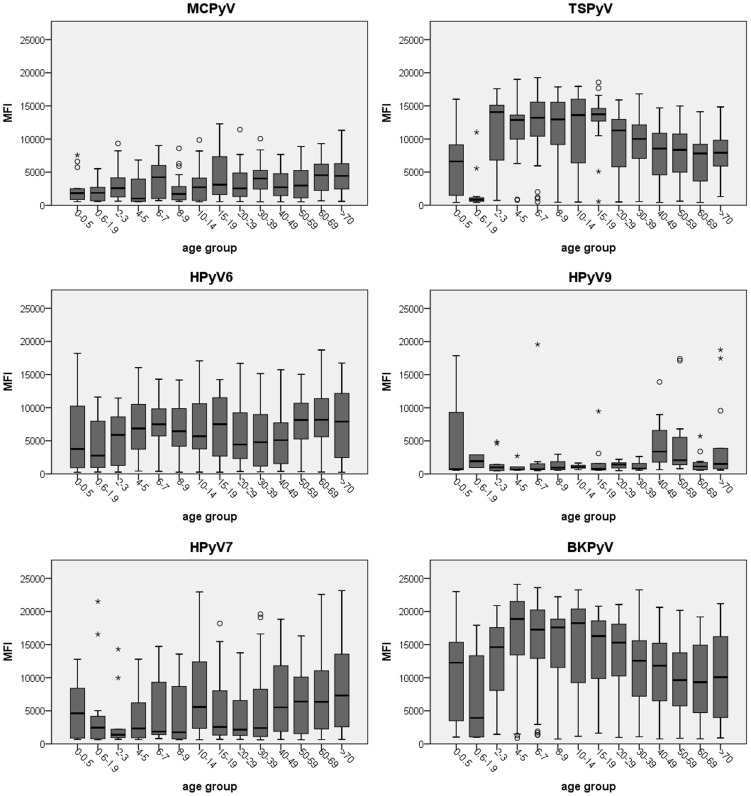
Figure 5. Age-specific seroreactivity against MCPyV, HPyV6, HPyV7, TSPyV, HPyV9 and BKPyV.
The age-specific seroreactivity is measured amongst the respective seropositive individuals. The horizontal line in each boxplot represents the median MFI value. The box includes the 25%–75% MFI value range and the whiskers the 5%–95% MFI value range. Outliers are represented as a circle and extreme outliers as an asterisk.

