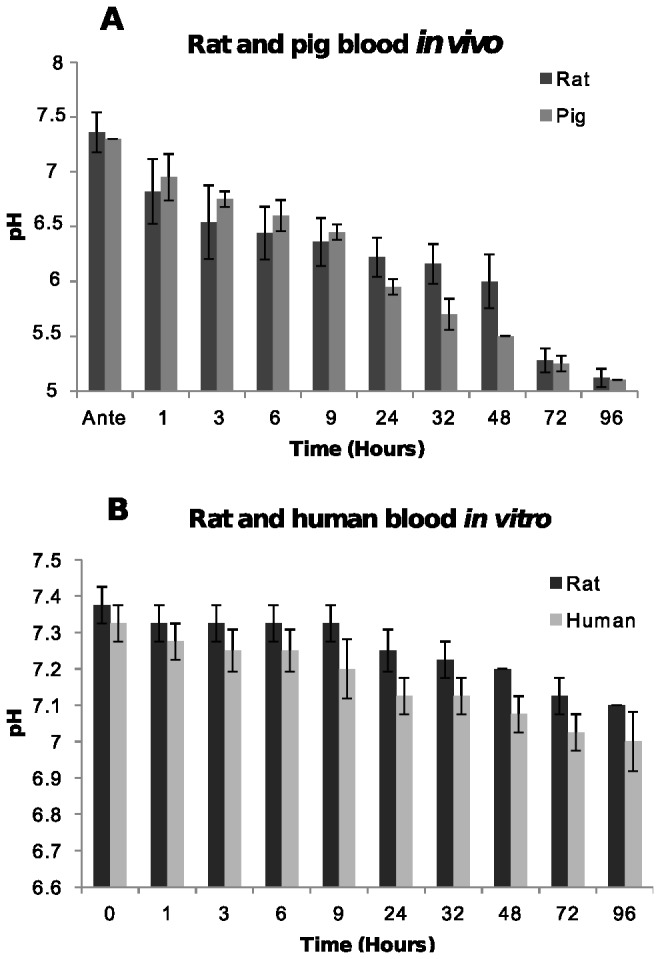
Figure 1. Blood pH.

[A] In post-mortem blood from rat and pig corpses over 96 hours. The average pH of blood samples from five rat and two pig corpses at each time point are shown with standard deviations. [B] In human blood and rat blood stored in a tube. The average pH and standard deviations at each time point from two human and three rat blood samples are shown.
