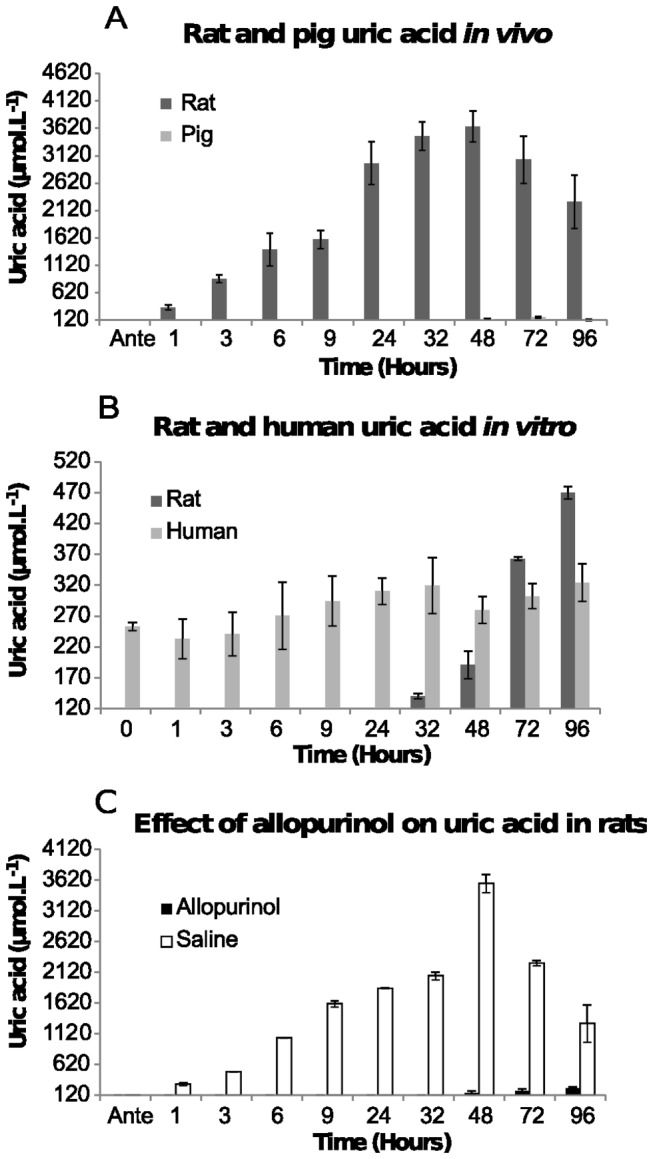
Figure 7. Concentration of uric acid.

[A] In post-mortem blood from rat and pig corpses over 96 hours. The average uric acid concentration in plasma and the standard deviations from five rats and two pigs at each time point are shown. [B] In human blood and rat blood stored in a tube. The average uric acid concentration and the standard deviation at each time point from four human and two rat plasma samples are shown. [C] Affect of allopurinol on post-mortem rat uric acid concentrations. Three rats were administered allopurinol and one rat was given saline prior to euthanasia. The average concentration of uric acid is shown along with the standard deviations at each time point.
