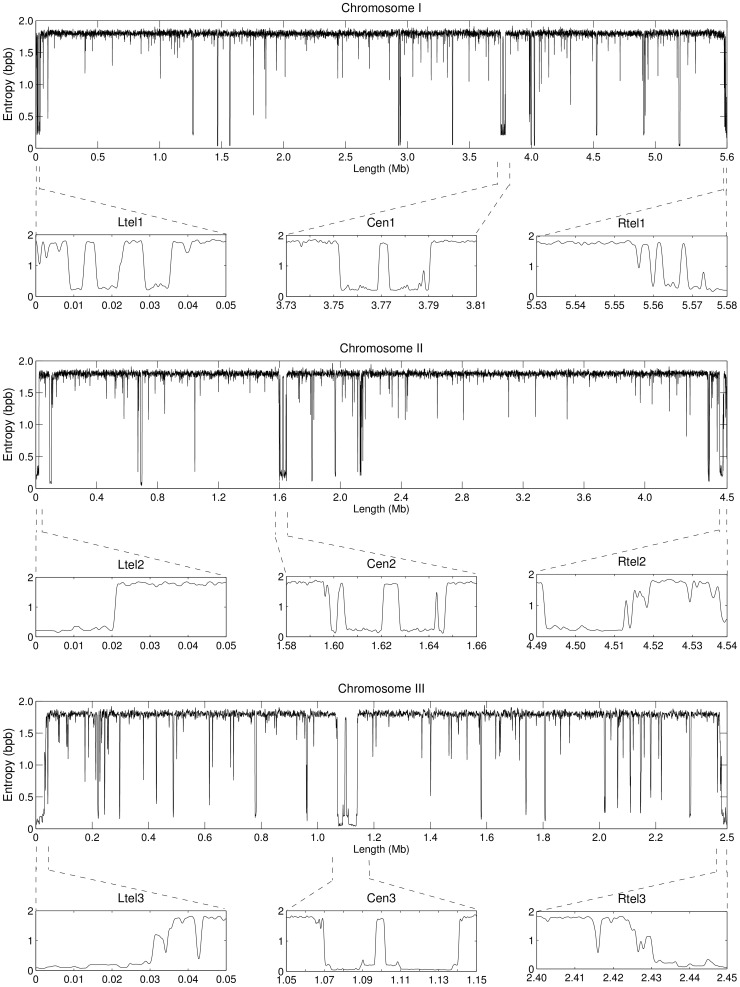
Figure 1. Information profiles of the chromosomes of S. pombe highlighting centromeric and telomeric regions.
The profiles are the result of eight competitive finite-context models with context depths 2, 4, 6, 8, 10, 12, 14 and 16. They represent the minimum of the combined direct and reversed profiles, low-pass filtered with a Blackman smoothing window of 1,001 bp. Probabilities were estimated with  for contexts 14 and 16. For clarity, the full chromosome profiles were sampled every 20 bp. Zoomed in profiles Ltel and Rtel display telomeric and subtelomeric regions of each chromosome, and zoomed in Cen profiles display the respective centromeric regions.

