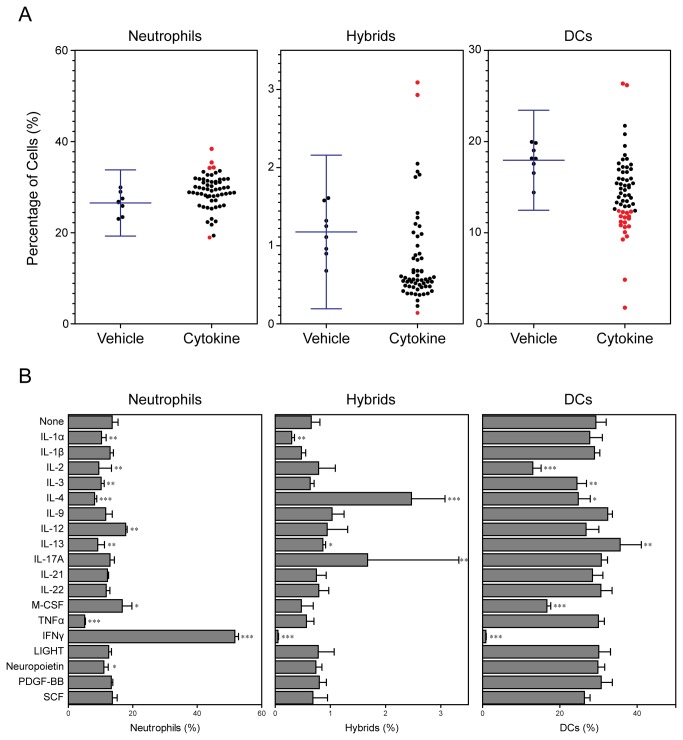
Figure 3. Differential impacts of cytokines tested in combination with GM-CSF.
BM cells were cultured in 96-well plates for 6 days with each of 60 different cytokines (10 ng/ml) in the presence of 10 ng/ml GM-CSF. The samples were examined in a semi-automated fashion for surface expression of CD11c, MHC II, and Ly6G. (A) Each dot represents the percentage of CD11c-/MHC II-/Ly6G+ neutrophils, CD11c+/MHC II+/Ly6G+ hybrids, or CD11c+/MHC II+/Ly6G− conventional DCs emerging in BM culture supplemented with a given cytokine. The baseline levels (means ± 3SD) observed in the control cultures with GM-CSF alone are shown on the left columns. “Hit” cytokines that increased or decreased the frequencies above or below the baseline levels are indicated in red. The data shown are representative of three independent screening experiments with similar results. (B) The hit cytokines were tested in triplicates at 10 ng/ml, again, in the presence of 10 ng/ml GM-CSF. The data shown are the means ± SD of the percentages of neutrophils, hybrids, and conventional DCs. Asterisks indicate statistically significant differences compared with the control cultures with GM-CSF alone (*P < 0.05, **P < 0.01, ***P < 0.001).

