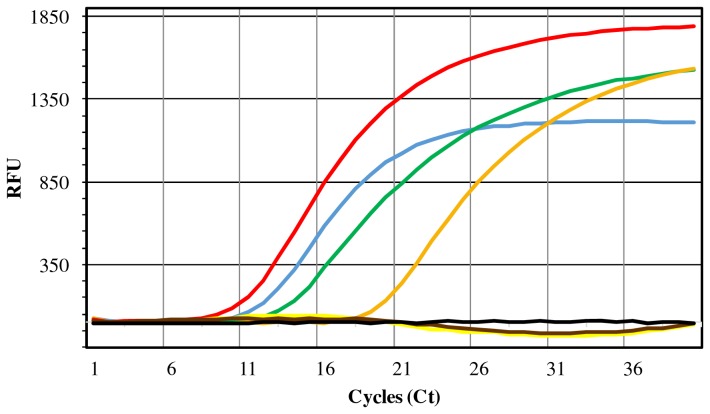
Figure 3. IS6110-targeted real-time PCR amplification curves obtained in specificity tests.
Illustration of the MTC-specific amplification curves obtained in FAM channel during evaluation of the analytical specificity of the IS6110-targeted real-time PCR step. All MTC cultures yielded amplification curves: M. tuberculosis ATCC 25177 (blue line), M. bovis LNIV 13027 (green line), M. bovis ATCC 27291 (orange line) and M. caprae LNIV 17320 (red line). Other bacteria yielded negative results of amplification: M. avium subsp. avium ATCC 25291 (yellow line) and M. avium subsp. paratuberculosis LNIV 39888 (brown line). No amplification was detected in non-template negative control (black line). RFU - Relative Fluorescence Units.

