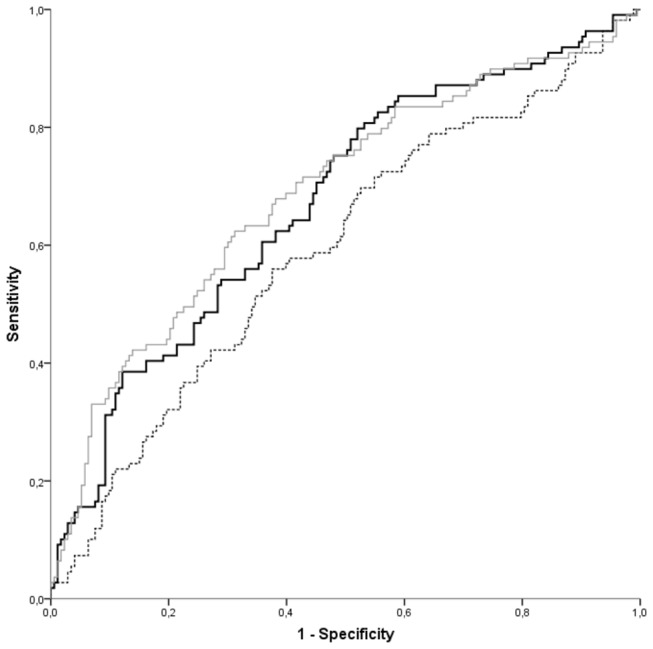
Figure 1. ROC curves for cardiovascular morbidity and mortality.

ROC curves for cardiovascular morbidity and mortality of three models: traditional risk markers (dotted line), traditional risk markers plus NT-proBNP (black line, p=0.023), and traditional risk markers plus all five new markers (a history of major CVD, MDRD, CRP, homocysteine and NT-proBNP) (grey line, p=0.0067) (N=282).
