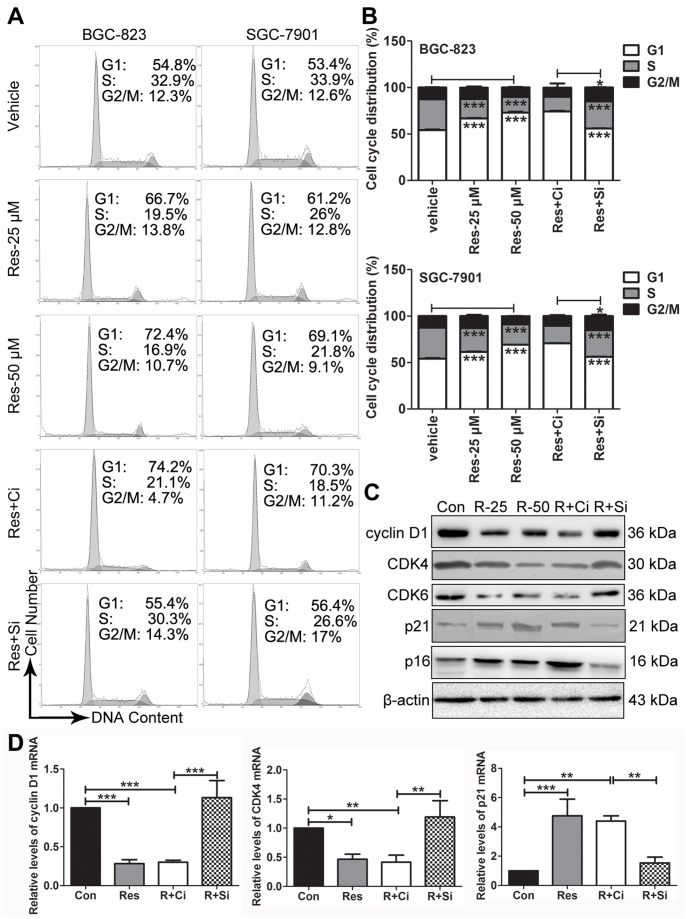
Figure 3. Res induces the accumulation of GC cells in G1 phase in a Sirt1-dependent manner.
The cell cycle distribution of the cells was analyzed by flow cytometry. The representative graphs are shown in (A). The quantitative analysis is demonstrated as histograms in (B). (C) The protein levels of regulators of cell cycle were detected by western blot. (D) The mRNA levels of regulators of cell cycle were detected by RT-QPCR. ‘Con’ represents vehicle treatment, ‘R’ represents resveratrol, ‘Ci’ represents the control siRNA, and ‘Si’ represents the Sirt1 siRNA. The data represent the mean ± SD, * represents P<0.05 and *** represents P<0.001.

