
Figure 4. Res induces senescence of GC cells in a Sirt1-dependent manner.
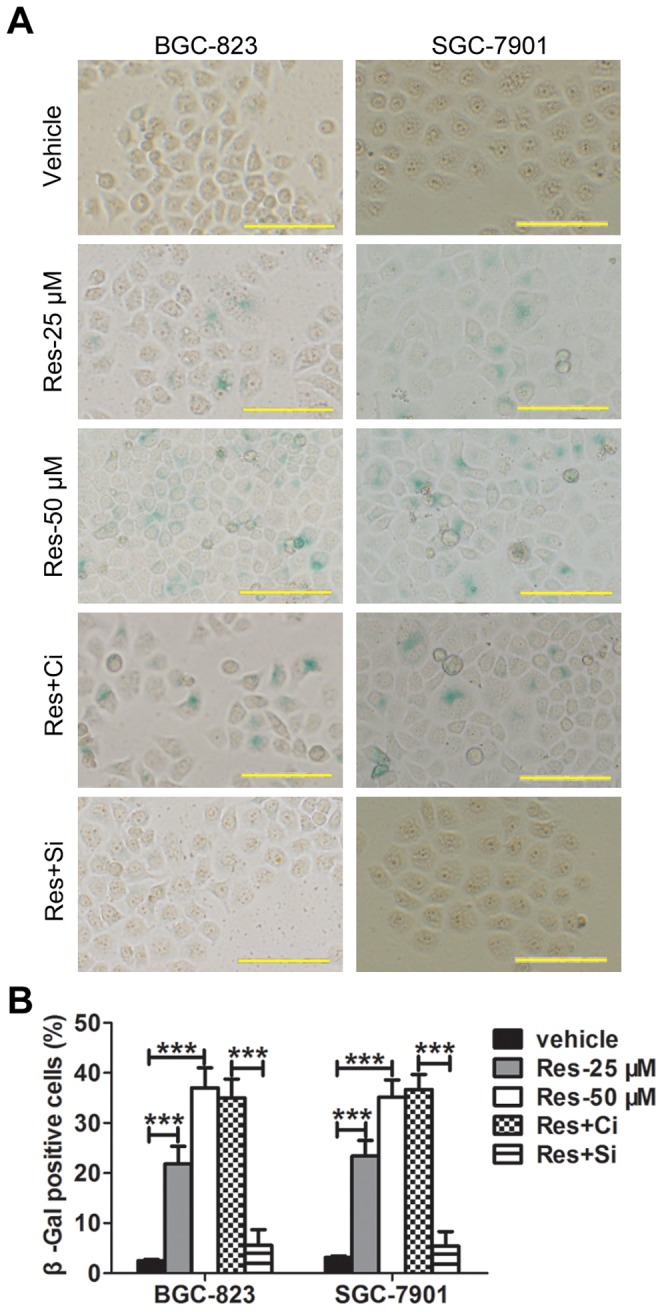
β-Gal staining was performed to detect senescent cells. The representative graphs are shown in (A). Magnification: × 200, bar for 100 µm. The quantitative analysis is demonstrated as a histogram in (B). ‘Ci’ represents the control siRNA and ‘Si’ represents the Sirt1 siRNA. The data represent the mean ± SD, the statistical results are indicated by asterisks and *** represents P<0.001.