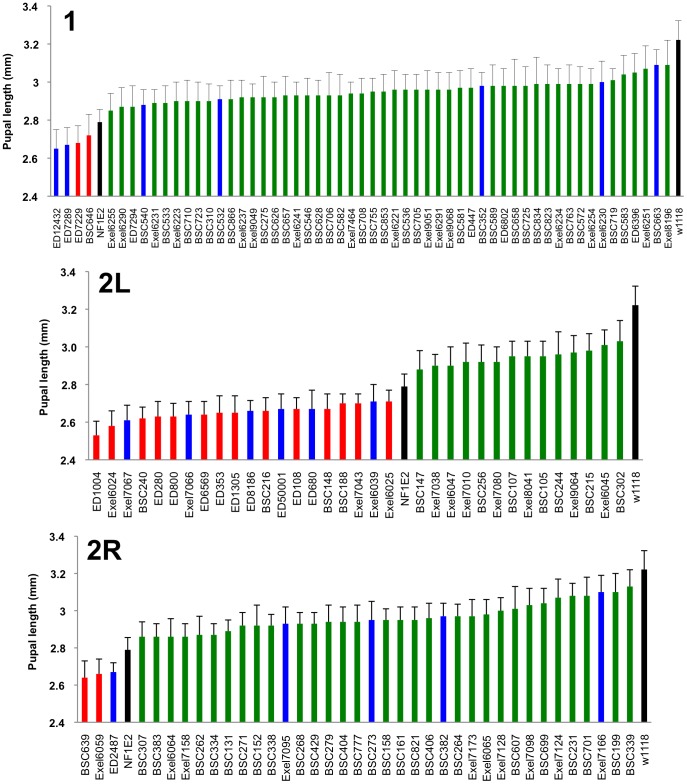
Figure 4. Identified deficiencies increase or decrease pupal size to different extents.
Female pupal lengths for the indicated 1, 2L and 2R deficiencies. Control measurements for dNf1E2 and wild-type (w1118) are in black. Colors for enhancing, suppressing and non-specific deficiencies are as in Figure 2. Pupal lengths are shown in mm, error bars denote standard deviations and are based on measurements described in Table S2. All shown deficiencies modify dNf1 female pupal size with p-values<0.01.

