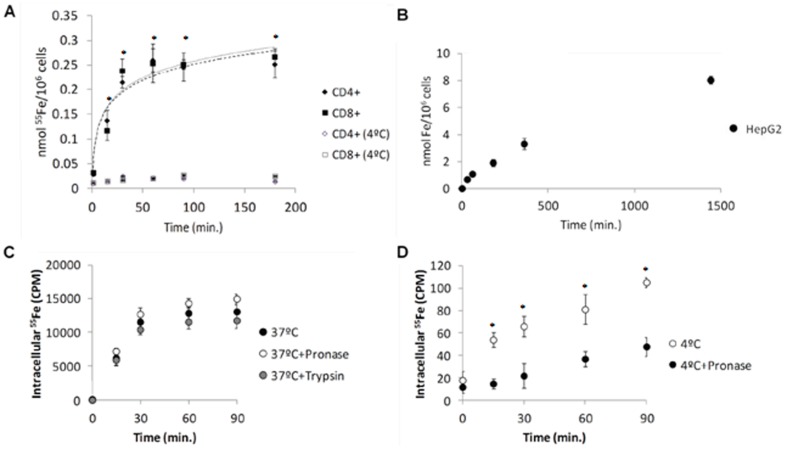
Figure 1. Similar patterns of NTBI uptake by T lymphocytes and hepatocytes.
(A) NTBI uptake by human T-lymphocytes. CD4+ and CD8+ human T-lymphocytes were incubated with 5 µM of 55Fe-citrate (5∶100) at 37°C and 4°C and intracellular iron quantified at each time-point. Each point = average (n≥3) ±1SD. (B) NTBI uptake by HepG2 cells. HepG2 cells were incubated with 5 µM of 55Fe-citrate (5∶100) for up to 24 hours, at 37°C. Cell-associated 55Fe levels at each time point were measured. Each point is a mean value (n = 6) ± SD. Both T-lymphocytes and HepG2 cells are able to accumulate NTBI presenting a high rate of uptake during the first 30 minutes of incubation (C–D) Specificity of NTBI uptake. CD3+ cells were incubated with 5 µM of 55Fe-citrate (5∶100) for up to 90 min, at 37°C (C) or 4°C (D), and at each time point washed either with PBS (with or without pronase) or incubated for 15 min with serum-free RPMI with trypsin. Cell-associated 55Fe levels at each time point were measured. Each point is a mean value (n = 3) ± SD. The similar results obtained at 37°C together with the differences at 4°C suggest that most of the measured iron is intracellular. Statistical significance between samples at 37°C and controls at 4°C is indicated by * symbols (*p<0.01).

