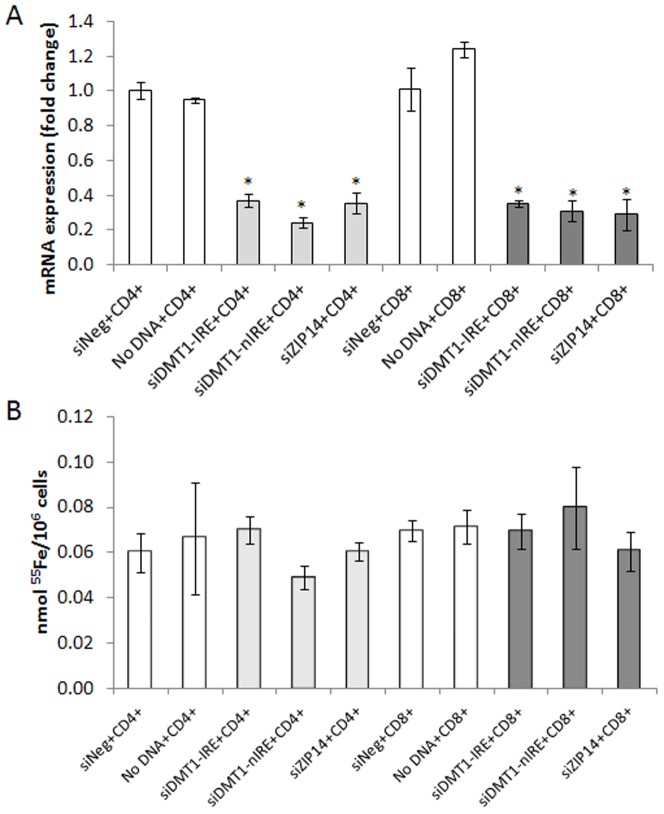
Figure 7. Involvement of NTBI transporters in Ferric citrate uptake by T lymphocytes.
mRNA levels (A; qRT-PCR) and corresponding NTBI uptake (B) by CD4+ and CD8+ T lymphocytes following nucleofection with siRNAs specific for ZIP14, DMT1-IRE and DMT1-nIRE, with scrambled siRNAs (siNeg) or with no DNA as controls. Each column represents the mean value (n = 3) ± SD. Statistical significance between samples (grey columns) and controls (white columns) is indicated by * symbols (*p<0.01). No differences in Fe∶citrate uptake were observed after silencing DMT1 or ZIP14.

