
Figure 2.
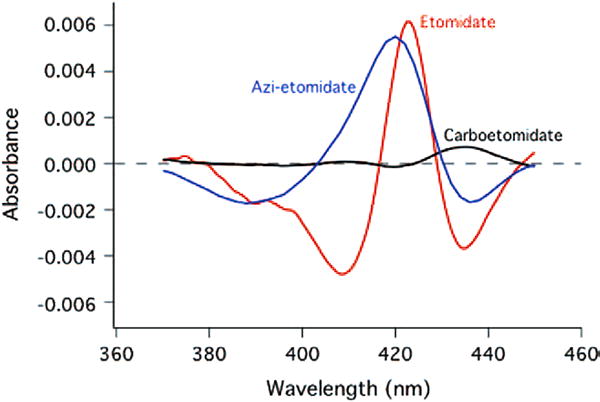
Spectral change induced by addition of etomidate (red curve) or carboetomidate (black curve), both at 40 μM, to purified human 11β-hydroxylase.
Official websites use .gov
A
.gov website belongs to an official
government organization in the United States.
Secure .gov websites use HTTPS
A lock (
) or https:// means you've safely
connected to the .gov website. Share sensitive
information only on official, secure websites.
Spectral change induced by addition of etomidate (red curve) or carboetomidate (black curve), both at 40 μM, to purified human 11β-hydroxylase.