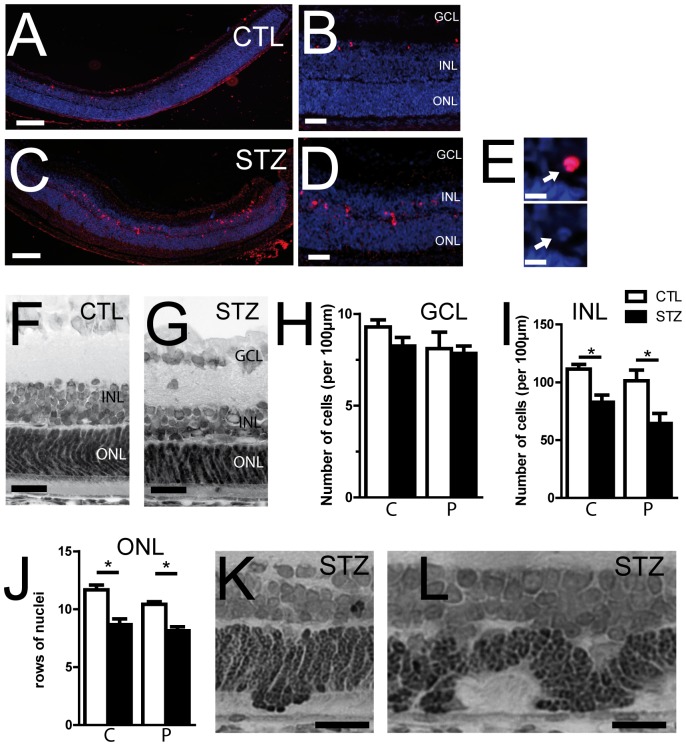
Figure 6. Hyperglycemia induces apoptosis and retinal degeneration.
A–D. Retinal sections of STZ (C, D) and CTL (A, B) P6 animals were stained with the TUNEL labeling kit (red) and counterstained with DAPI. TUNEL labeling revealed the presence of apoptotic and fragmented nuclei in the INL of STZ retina (E). F–G. Representative histological toluidin-blue stained retinal sections in CTL (F) and STZ (G) P14 rat pups. H–I. Quantification of the number of nuclei per 100 µm in the central part (C) and the periphery (P) of the ganglion cell layer (H) or the INL (I), in hyperglycemic (black bar) and normoglycemic P14 animals (white bar). J. Quantification of the number of row of photoreceptor nuclei in the central part (C) and the periphery (P) of the retina, in hyperglycemic (black bar) and normoglycemic P14 animals (white bars). Values are mean +/− SEM of 9–10 retinas from 2 different experiments (H; I; J). * p<0.05; one-way ANOVA followed by Bonferroni post-tests. The number of nuclei in the INL and ONL was significantly reduced in STZ animals compared to CTL; this effect was predominant at the periphery of the retina. K–L. Representative histological toluidin-blue stained retinal sections of P14 STZ rat pups showing advanced structural disorganization with rosettes (K) and folds in the outer nuclear layers (L). Scale bars: 100 µm in A and C; 50 µm in B and D; 5 µm in E; 20 µm in F, G, K and L. GCL = ganglion cell layer; INL = inner nuclear layer; ONL = outer nuclear layer.

