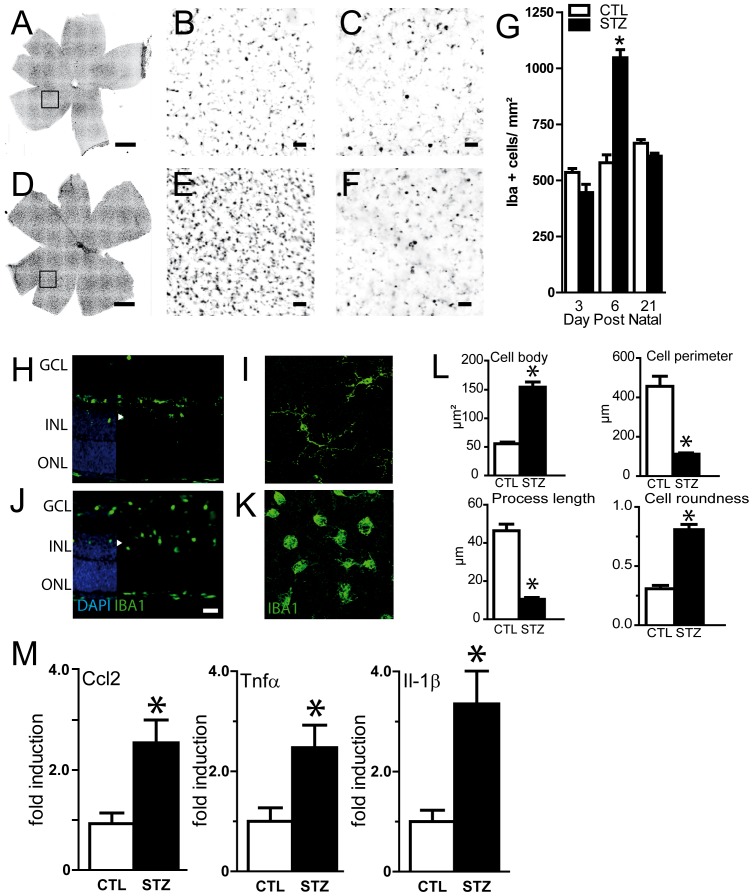
Figure 7. Effect of neonatal hyperglycemia on macrophage/microglial cells (MP/MC) recruitment.
A–F. Retinal flatmounts and sections were stained with Iba-1 antibody. Representative flatmounts and sections of control (A, B) and STZ (D, E) P6 animals or P21 animals (C, F). G. Quantification of Iba-1 positive cells at different time points in CTL (white bars) and STZ (black bars) animals. MC recruitment peaked at 5–6 days postnatal. Values are mean +/− SEM. *p<0.05 Two-way ANOVA, Bonferroni post-test. H–K. Retinal sections and flatmounts of CTL (H–I) and STZ animals (J–K) were stained with Iba-1 antibody. MC/MP were located deeper in the retina of in hyperglycemic animals, reaching the inner nuclear layer (J) and displayed a change in their morphology, with round, bloated bodies and short ramifications indicative of an activated state (K). L. Cell body size, number of processes, length of the processes and perimeter length of Iba1 positive cells were determined for control (white bars) and hyperglycemic (black bars) animal at P6. Values in histograms are mean ± SEM of at least 50 cells selected in 3 different experiments. *p<0.05, Unpaired t-tests. M. Real-time PCR of Ccl2, Tnfα and Il-1β in P6 rat pups retinas exposed to hyperglycemia (STZ, black bars; n = 5) compared to controls (CTL, white bars, n = 5). *p<0.05, Unpaired t-tests compared to controls. Nuclei were counterstained with DAPI in H and J. Scale bars: 1 mm in A and D; 50 µm in B–C, E–F and H–K. GCL = ganglion cell layer; INL = inner nuclear layer; ONL = outer nuclear layer.

