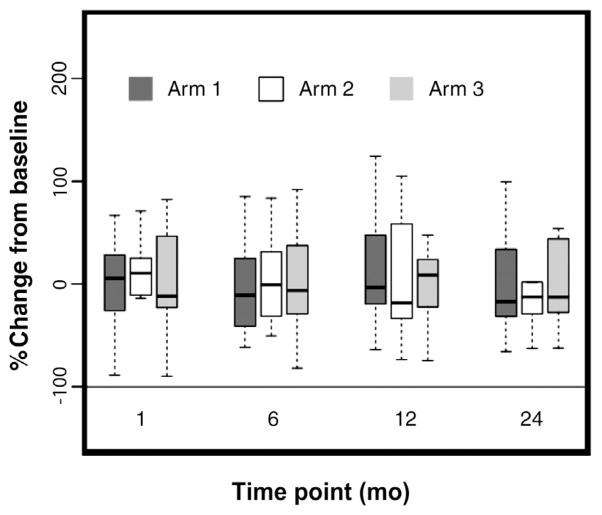
Figure 3.
Percentage Change in Bone-specific Alkaline Phosphatase (BSAP) From Baseline. Sera Were Collected at Baseline, 1-, 6-, 12-, and 24-mo and Were Assayed for BSAP Concentration by Enzyme-Linked Immunosorbent Assay. Box Plots Represent the Percentage Change From Baseline in Serum BSAP for Patients at the Indicated Time Points for Each Arm of the Study. The Black Line Within the Box Represents the Median of the Percentage Changes. The Top and Bottom Edges of the Boxes Represent the 25th and 75th Percentiles of the Percentage Changes. The 5th and 95th Percentiles Are Represented by the Whiskers Extending From the Top and Bottom of the Box

