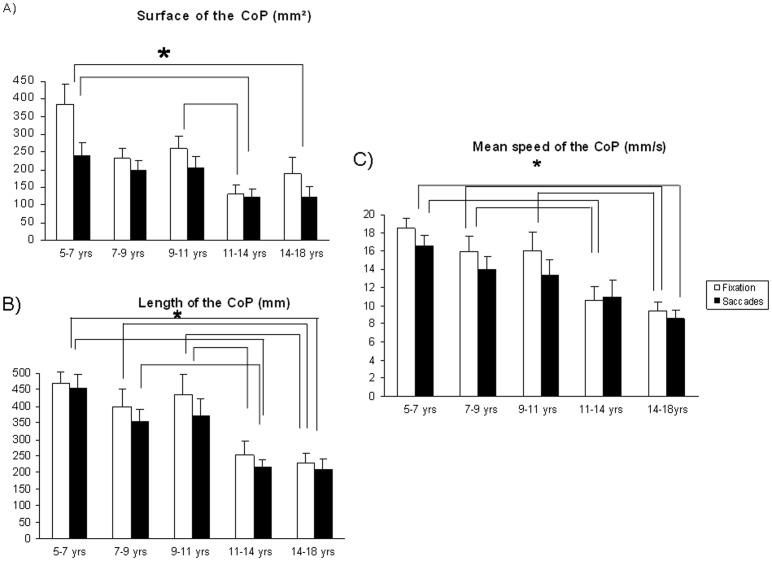
Figure 2. Postural parameters recorded during fixation and saccades for the five groups of subjects.
Figure 2A: Mean values of the surface of the CoP (in mm2) during fixation and saccades. Vertical bars indicate the standard error. Asterisks indicate that the value is significantly different (p<0.05). Figure 2B: Mean values of the length of the CoP (in mm) during fixation and saccades. Vertical bars indicate the standard error. Asterisks indicate that the value is significantly different (p<0.02). Figure 2C: Mean values of the mean speed of the CoP (in mm/s) during fixation and saccades. Vertical bars indicate the standard error. Asterisks indicate that the value is significantly different (p<0.03).

