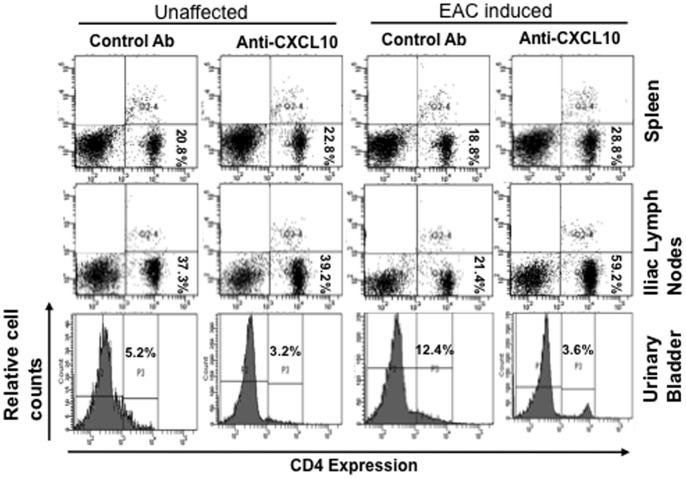
Figure 4. Change in number of CD4+T-cell lymphocytes in EAC mice after anti-CXCL10 Ab treatment.
At the end of experiments, lymphocytes from the spleen, iliac lymph nodes, and urinary bladder were isolated, stained for CD4+ T cell expression, and analyzed by flow cytometry. A representative histogram is shown with the mean percentage of spleen, iliac lymph node, and urinary bladder CD4+ cells per mouse. The data presented are representative dot plots and histograms from three independent experiments involving 5 mice per group.

