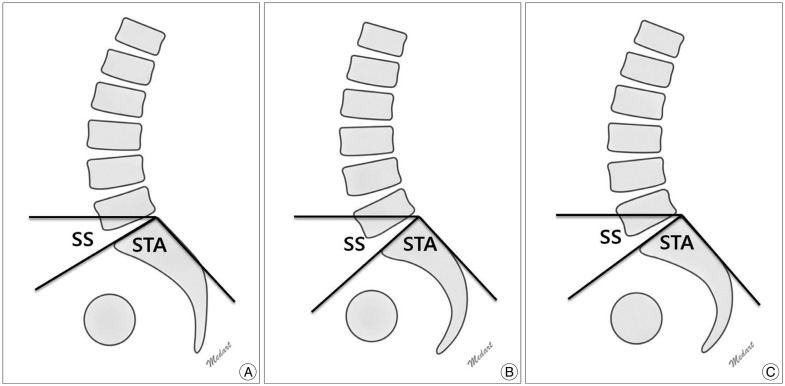
Fig. 1.
Schematic lumbar spine lateral images. A : Example of patients with spondylolysis. B : Example of patients without spondylolysis. SS is higher in the spondylolysis group, but STA is higher in the control group. C : Shows possible changes in sagittal balance when LL increased to maintain center of gravity and C7 plumb line behind the hips in patients with spondylolysis. SS : sacral slope, STA : sacral table angle, LL : lumbar lordosis.

