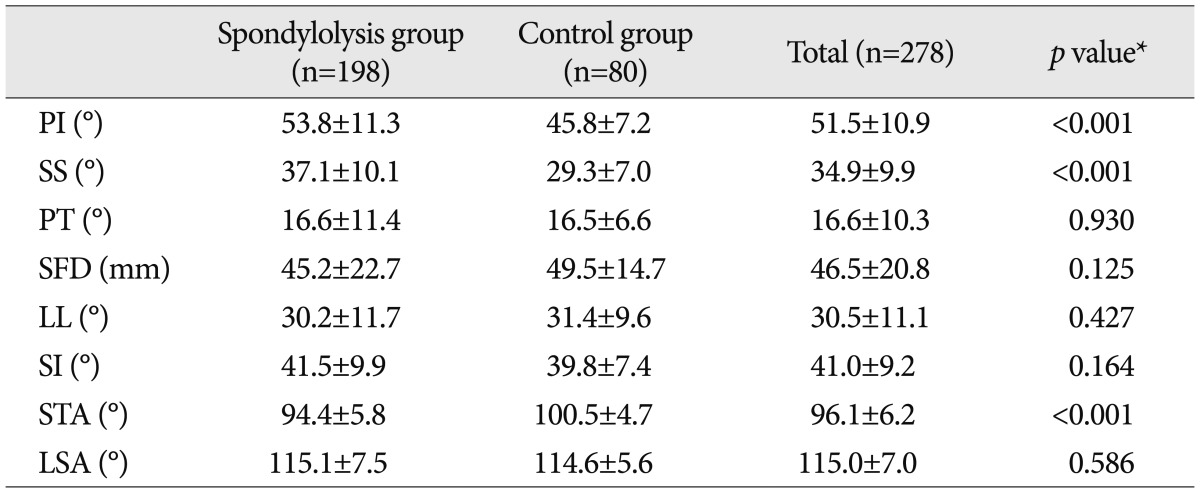
Table 2.
Comparison of the spinopelvic parameters between the spondylolysis group and the control group

Values represent mean±SD. *Statistical analysis by t-test. PI : pelvic incidence, SS : sacral slope, PT : pelvic tilt, SFD : sacro-femoral distance, LL : lumbar lordosis, SI : sacral inclination, STA : sacral table angle, LSA : lumbosacral angle
