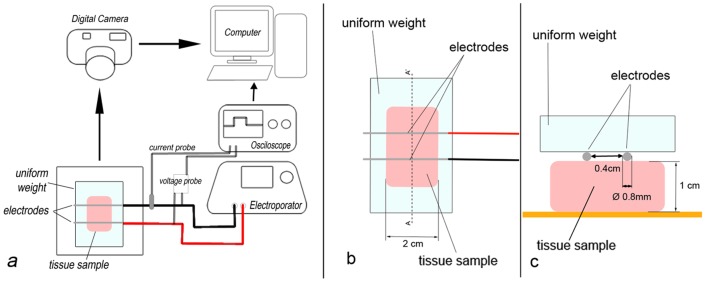
Figure 1. Experimental setup.

a. the two-needle electrode was placed over the tissue sample (under a uniform weight) and connected to the electroporator, during the pulses the electric current and potential were monitored with an oscilloscope, color changes in the dye after the pulses were recorded with a video camera and analyzed in a PC; b. zoom of the tissue sample with the two-needle electrode placed over it; c. cross section (A-A′) of the tissue sample and the two-needle electrode.
