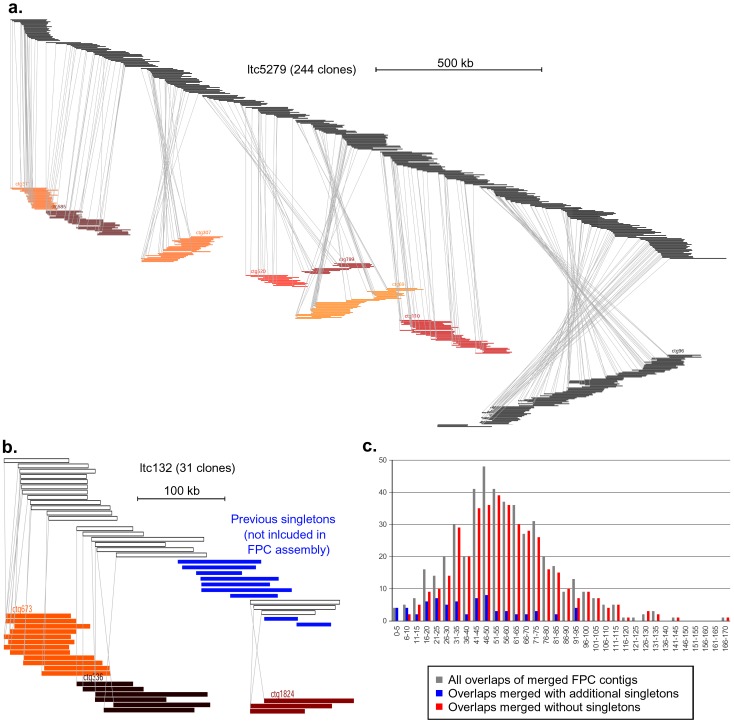
Figure 2. Comparison of LTC and FPC assemblies.
a. The BAC clones constituting the contig ltc5279 are depicted at the top. Underneath, FPC contigs which cover corresponding regions are displayed. Gray lines connect the start points of corresponding BACs. Contig ltc5279 (approximately 2,161 kb in size) which is the fusion product of eight smaller FPC contigs. Overall, the relative positions of BAC clones within LTC and FPC contigs are very similar. b. Example of three small FPC contigs which are merged into one LTC contig (ltc132). This LTC contig also includes BACs which were singletons in the FPC assembly (blue). Note that in a and b the scales are different. c. Size distribution of overlaps of FPC contigs which were merged in the LTC assembly. The x-axis indicates the size range of overlaps of two FPC clones that were merged by LTC. The y-axis shows how many cases were identified in each size range. The gray series shows the size distribution of all overlaps. The blue series shows only those cases where additional singletons were included to merge FPC contigs while the red series shows the cases where no additional clones were used for the merging.

