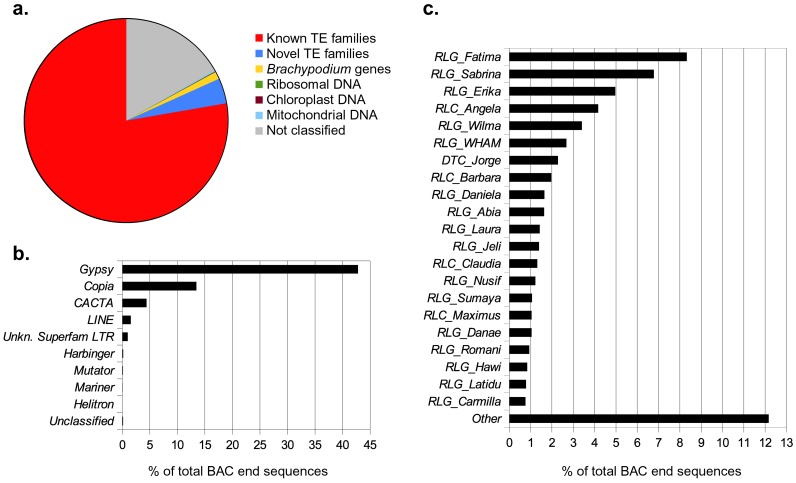
Figure 3. Sequence composition of minimum tiling path BAC-end sequences from chromosome 1AS.
a. Pie chart indicating the composition of chromosome 1AS MTP BAC-ends. b. and c. Composition of the TE fraction. b. Composition of TE superfamilies. c. Composition of the TE fraction broken down into TE families. The three-letter code preceding the family name is according to the TE classification system proposed by Wicker et al., 2007.

