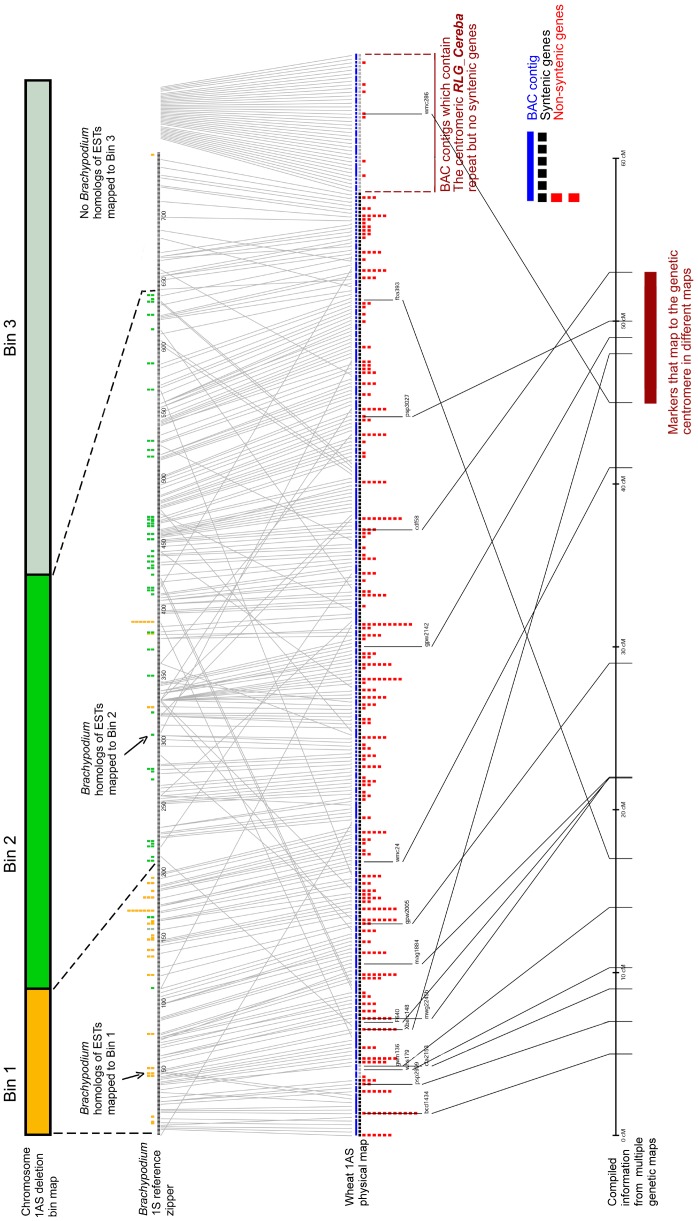
Figure 4. Physical map of wheat chromosome 1AS.
The figure integrates multiple sequence resources. a. Chromosome 1AS deletion bin map with the three bins shown in (yellow, green and gray). ESTs from the three deletion bins which were mapped to Brachypodium reference zipper genes are indicated with boxes with colour of the corresponding bin. If more than one EST mapped to the same Brachypodium gene, the boxes were stacked on top of each other. This information was used to estimate the boundaries of each deletion bin in the Brachypodium reference zipper (dashed lines). b. Brachypodium reference zipper. c. Physical map of the 1AS chromosme arm. BAC contigs are symbolised with blue lines (see enlarged legend at the right). The length of the line reflects the number of putative syntenic genes found on the contig, not its physical size. Syntenic genes are also symbolised by black boxes. The number of non-syntenic genes for each contig is indicated with a stack of red boxes. Grey boxes indicate place holders for contigs that contained no syntenic genes but were anchored by means other than synteny (e.g. genetic markers of centromere-specific repeats. d. Published genetic markers from chromosome 1AS that were used to deduce an estimated genetic map (marker and map names and genetic distances are detailed in Table 1).

