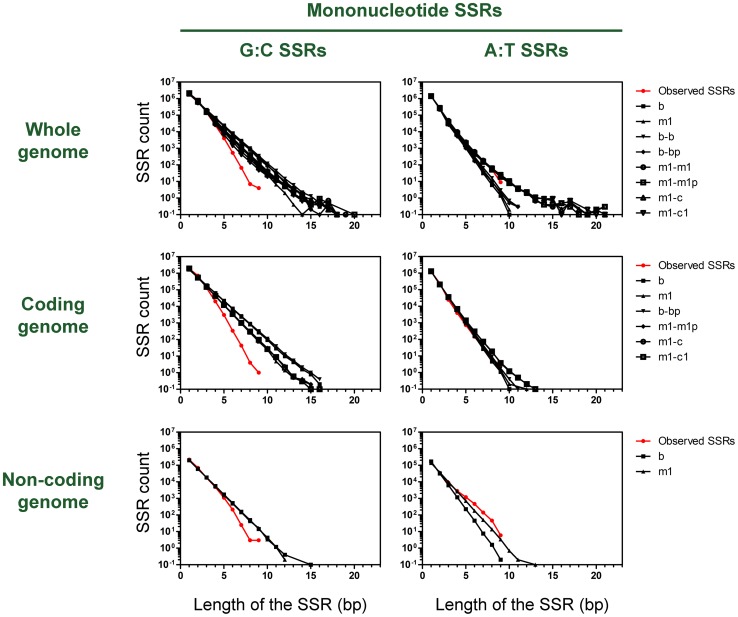
Figure 1. Mononucleotide SSRs in the P. aeruginosa PAO1 genome.
The plots show the counts for mononucleotide SSRs (red circles) in the whole P. aeruginosa PAO1 genome and in random sequences generated by various predictive models (black symbols). b and m1: homogeneous models (Bernoulli and first-order Markov); b-b, b-bp, m1-m1, m1-m1p, m1-c and m1-c1: heterogeneous models (see Methods). Counts are shown of mononucleotide G:C and A:T SSRs in the coding and non-coding regions of the genome.

