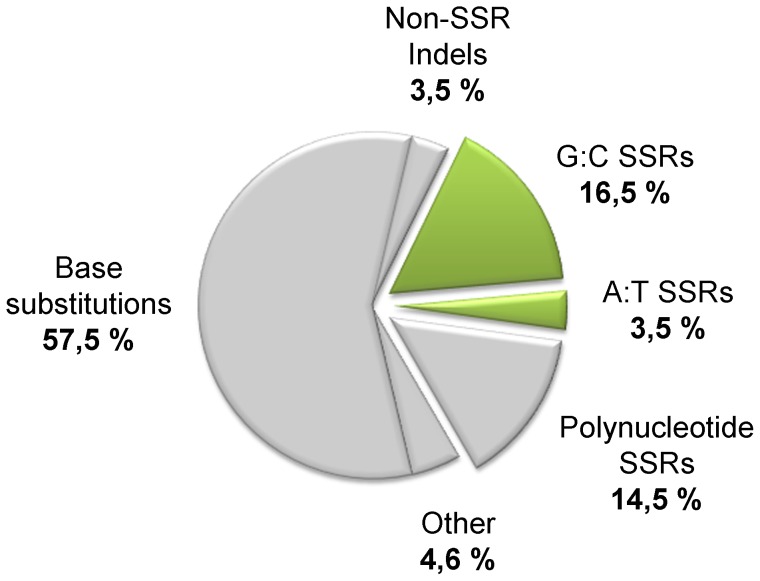
Figure 2. Genetic changes in P. aeruginosa PACS2.
The pie-chart shows the distribution of 85 independent mutational events that occurred in the genome of P. aeruginosa strain PACS2 during the process of chronic infection, as reported by Smith et al. [1]. Percentages are shown of base substitutions and of indels falling inside the SSRs or outside (referred to as Non-SSR indels). Large indels (>100 bp) or insertion elements are indicated as “other” mutations. Mutations within SSRs, either mononucleotide or polynucleotide (tandem repetition of short DNA motives), are shown as detached slices. Slices corresponding to mononucleotide G:C and A:T SSRs are shown in green.

