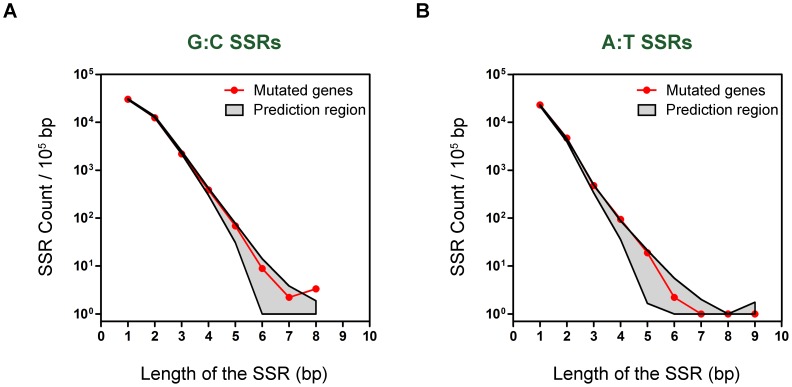
Figure 4. Mononucleotide SSRs in the 60 mutated genes compared with the genome coding region of P. aeruginosa PACS2.
The plots show the numbers of mononucleotide G:C SSRs (A) and A:T SSRs (B) (normalized to SSR count every 105 bp) in the pooled coding sequence of the 60 genes mutated during the process of chronic infection (red curve) and in the 99% prediction region (grey area) estimated by re-sampling 60 genes at random, with reposition, from the whole coding genome of P. aeruginosa PACS2. The sampling was repeated 50000 times to obtain a good estimation of empirical distributions of SSR counts. From these distributions the extreme 0.5% and 99.5% quantiles were estimated to build the 99% prediction intervals for each length of SSR. Points of the curve which fall outside of the prediction area were considered to be statistically significant (p = 0.01).

