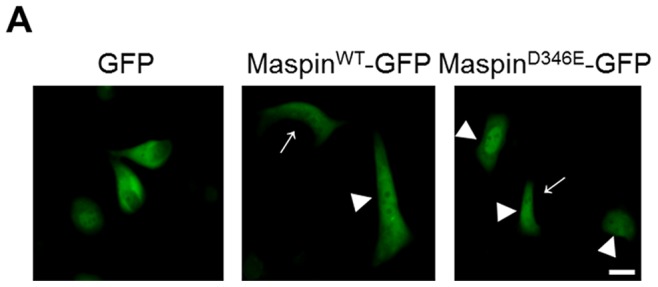
Figure 3. Dominant nuclear localization of maspinD346E in cells that naturally distribute maspin to cytoplasm and nucleus.

(A) Immunofluorescent imaging of live PC3 cells 48 hrs after transient transfection with pEGFP N1-maspinWT and pEGFP N1-maspinD346E → indicates cytosolic maspin whereas ▸ indicates nuclear maspin. pEGFP was used as a control. Scale bar = 20 µm.
