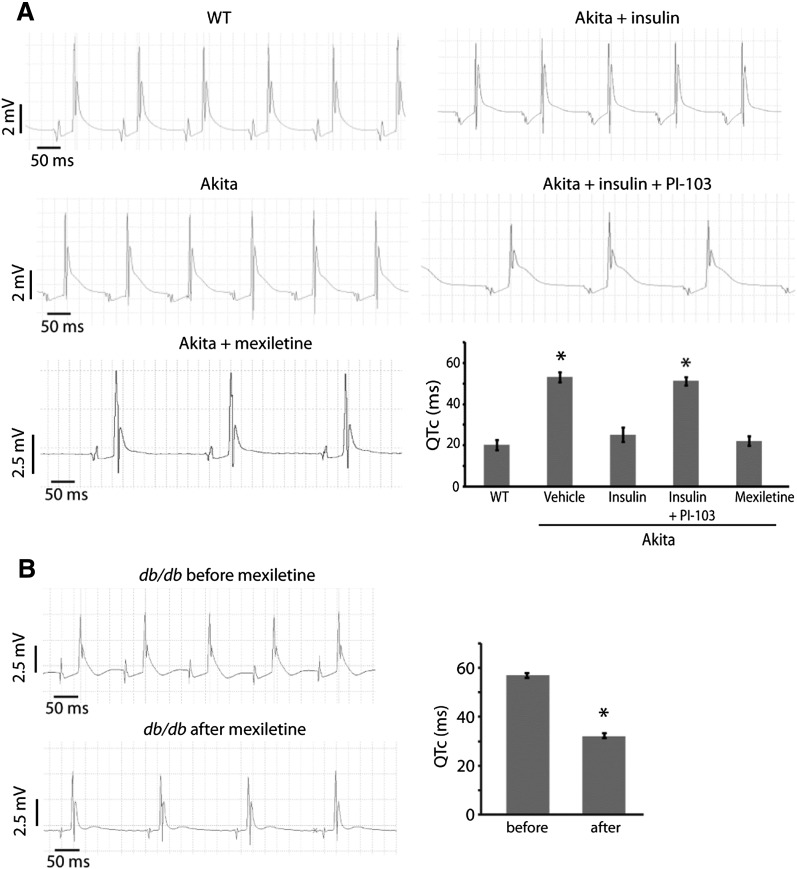
FIG. 3.
QT prolongation of Ins2Akita (Akita) and db/db hearts and reversal by mexiletine. Cardiac electrical activity was recorded from spontaneously beating hearts mounted on a Langendorff apparatus. QT intervals corrected for heart rate (QTc) were automatically calculated from the tracings using the Mitchell formula (15). A: Representative tracings from Akita and wild-type (WT) hearts. Hearts were treated with insulin (1 unit/L), PI-103 (500 nmol/L), or mexiletine (4 μg/mL) added to the perfusate. Summary QTc graph shows mean ± SE (bottom right). n ≥ 4 hearts per group. *, significantly different from WT values (P < 0.05, ANOVA with post hoc Fisher least significant differences test). B: Representative tracings from a db/db heart before and after mexiletine treatment. Summary QTc graph shows mean ± SE (right). n = 5 hearts. *, significantly different from before values (P < 0.05, Student t test).

