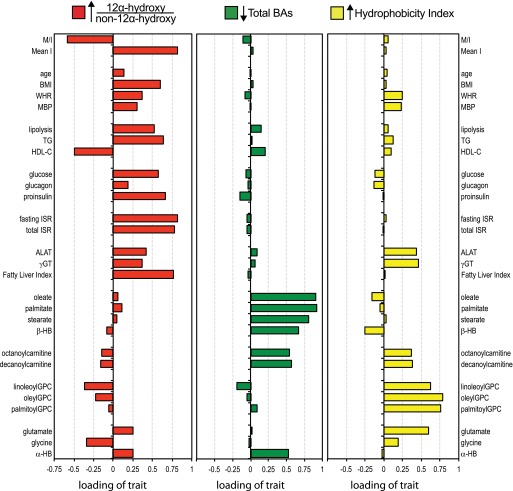
FIG. 2.
Identification of three factors underlying the correlation pattern of the entire dataset of 200 nondiabetic subjects. The size of the bars (x-axis) is the loading of each individual trait on each of three BA-related characteristics. The 12α-hydroxy/non–12α-hydroxy ratio has the highest positive loading score on the first factor (red); total BA concentration has the lowest score on the second axis (green); and the HI has the highest loading on the third factor (yellow). Results are from a principal component analysis with varimax rotation. ISR, insulin secretion rate; MBP, mean blood pressure; mean I, mean insulin; WHR, waist-to-hip ratio. Fatty liver index is the surrogate index of hepatic steatosis based on an algorithm using BMI, waist circumference, TGs, and γGT validated against liver ultrasound (25).

