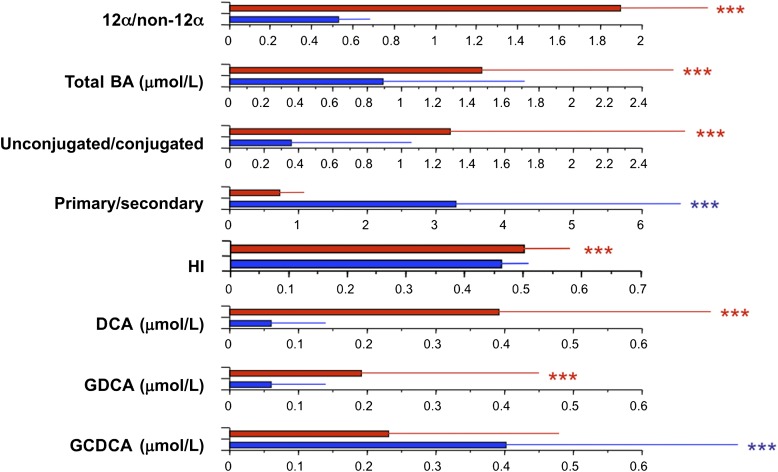
FIG. 3.
Comparison of BA characteristics between subjects in the top (red bars) and bottom quartile (blue bars) of the distribution of the 12α-hydroxy/non–12α-hydroxy ratio in 200 nondiabetic subjects. Bar plots are median and interquartile range for the variables listed on the left-hand side. ***0.01 ≥ P ≥ 0.001, by Kruskal-Wallis test. GCDCA, glycochenodeoxycholic acid; GDCA, glycodeoxycholic acid.

