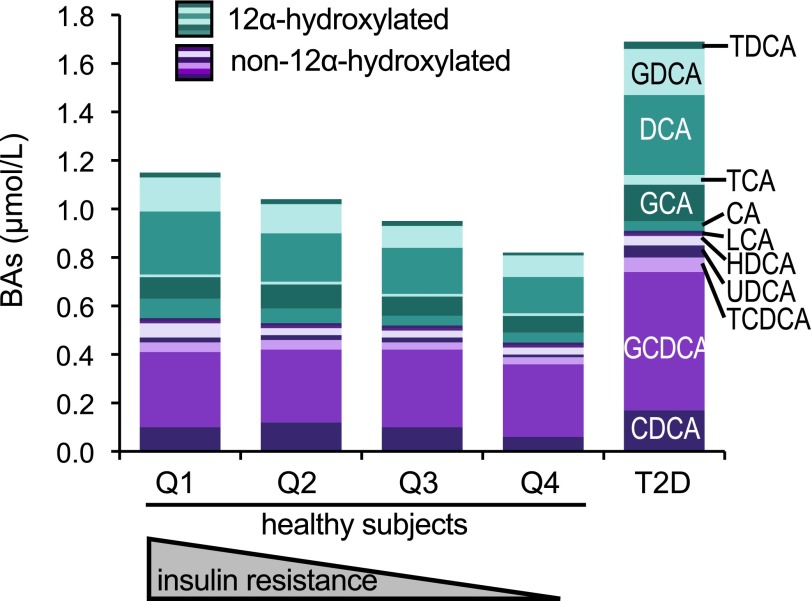
FIG. 5.
Stacked bar plot of plasma levels of the major BAs in 200 nondiabetic subjects (by quartile of insulin sensitivity [Q1–Q4]) and in 35 patients with T2D. 12α-Hydroxylated species are colored in shades of teal; non–12α-hydroxylated species are colored in shades of purple. GCA, glycocholic acid; GCDCA, glycochenodeoxycholic acid; GDCA, glycodeoxycholic acid; HDCA, hyodeoxycholic acid; TCA, taurocholic acid; TCDCA, taurochenodeoxycholic acid; TDCA, taurodeoxycholic acid.

