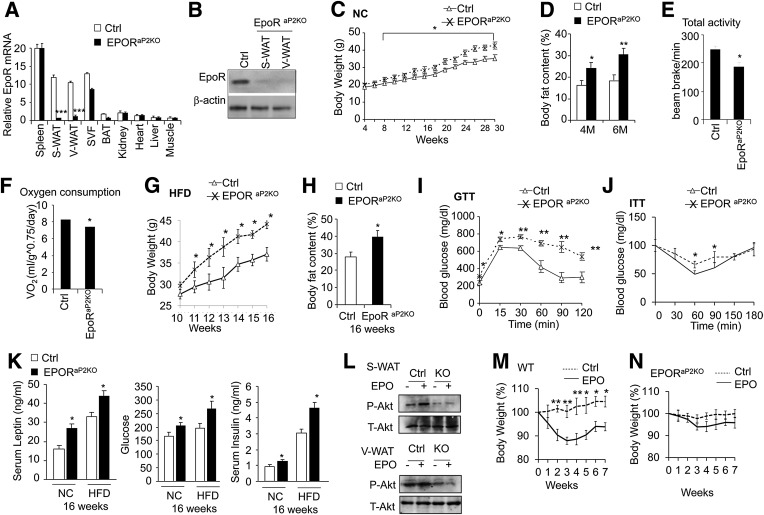
FIG. 1.
EpoRaP2KO mice become obese, glucose-intolerant, and insulin-resistant. A: EpoR mRNA levels in tissues from EpoRaP2KO mice and littermate controls were quantified using quantitative PCR. B: EPOR protein level in WAT from EpoRaP2KO mice and littermate controls (Ctrl; EpoRfl/fl). C: Body weight vs. age of EpoRaP2KO mice and littermate controls (Ctrl) are indicated for male mice (n = 10) fed a normal chow (NC) diet. D: Body fat mass content of EpoRaP2KO mice and littermate controls (Ctrl) at indicated age are shown for male mice (n = 6). M, months. Total activity (E) and total Vo2 (F) were determined for male WT and EpoRaP2KO mice (n = 6). Male EpoRaP2KO mice and littermate controls (Ctrl) were treated with an HFD for 6 weeks. Body weight was monitored weekly (G), and body fat mass content (H) was determined at 16 weeks (n = 6). GTT (I) and ITT (J) on male EpoRaP2KO mice and littermate controls (Ctrl) were performed at 16 weeks after HFD treatment for 6 weeks (n = 6). K: Serum insulin, glucose, and leptin levels were measured in EpoRaP2KO mice and littermate controls (Ctrl) fed NC and the HFD (n = 6). L: Total (T)-AKT and phosphorylated (P)-AKT in primary adipocytes of S-WAT and V-WAT isolated from EpoRaP2KO mice (KO) and control (Ctrl) mice were analyzed by Western blotting. WT (M) and EpoRaP2KO (N) mice (8.5 months of age) fed a normal diet were treated with EPO or saline (Ctrl) for 3 weeks (n = 6). Body weight was monitored weekly for up to 4 weeks after treatment. Bar graphs are mean ± SEM. *P < 0.05; **P < 0.01; ***P < 0.001.

