FIG. 4.

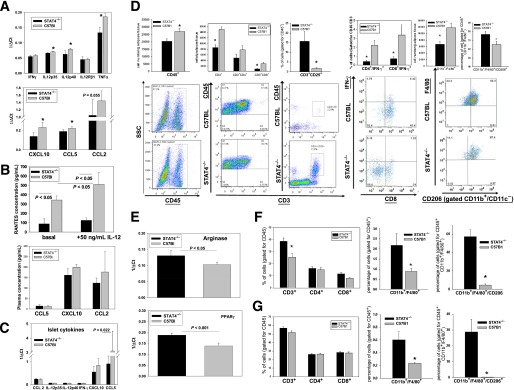
Effect of STAT4 deficiency on inflammation and immune cell composition in AT, adipocytes, SVF, secondary lymphoid organs, and pancreatic islets of STAT4−/− and control HFD mice. A: Proinflammatory cytokines and chemokines were measured by real-time PCR in adipocytes isolated from perigonadal fat of STAT4−/−C57Bl6 and control mice on an HFD (n = 7–9). Results are expressed as 1/ΔCt after normalization to actin. Data represent the mean ± SEM. *Significance established for P < 0.05. B: AT explants (∼1–2 mm3 pieces), prepared from STAT4−/−C57Bl6 or control mice (n = 4) on an HFD for 16 weeks, were kept in culture for 24 h and subsequently treated with 50 ng/mL IL-12 for 6 h. Concentration of RANTES (CCL5) was measured in the culture media by ELISA. RANTES was also measured in fasted plasma from the same groups of mice (n = 7–9); CCL2 and CXCL10 were measured in plasma using antibody-conjugated beads by flow cytometry (Flow Cytomix; eBioscience). C: Pancreatic islets were isolated from both groups after 16 weeks of an HFD, and gene expression was measured by real-time PCR. Data are expressed as 1/ΔCt after normalization to β-actin. Results represent average ± SEM from n = 6 mice per group. D: Immune cell composition of the SVF prepared from perigonadal AT of STAT4−/−C57Bl6 mice and wild-type controls on an HFD. SVF was stained with fluorescently labeled anti-mouse antibodies and analyzed by flow cytometry. In the three left panels, T-cell composition was analyzed. Cell numbers were calculated based on the corresponding antibody positivity and normalized to AT weight. To determine the percentage of different T-cell subsets, cells in the CD45+ gate were analyzed. Bottom plots are representative for the CD45+ gating and for the double positivity for CD3+ and CD45+ or CD25+ in each group. In the fourth panel on the left, SVF was additionally stained with an anti–IFN-γ antibody. The percentage of IFN-γ–positive cells in each T-cell subset was calculated after gating for CD45. In the last panel, SVF from the same mice were separately stained with fluorescently labeled anti-mouse CD45, CD11c, CD11b, F4/80, and CD206. The total macrophage numbers were expressed as CD11b+/F4/80+CD11c− cells and were normalized per tissue weight. Relative percentages of CD11b+/F4/80+CD206+ cells were measured within the CD45+ gate; a representative FACS plot for the latter is shown at the bottom. Results are average ± SEM from n = 6–8 mice/group; the null hypothesis was rejected for a P value <0.05. *Significant vs. C57Bl6 group. E: Gene expression for the M2 activation markers arginase and PPAR-γ were measured by real-time PCR in the SVF isolated from n = 4 mice per group. Results are expressed as 1/ΔCt after normalization to 18S ribosomal RNA and represent the mean ± SEM. Immune cell composition of the spleens (F) and lymph nodes (G) was measured by flow cytometry. Spleens as well as inguinal and lumbar (two each) lymph nodes were collected and stained with two different antibody cocktails, as described in research design and methods. Spleens (F) and lymph nodes (G) were analyzed for the relative percentage of CD3+ cells in the CD45+ gate and for relative percentages of CD4+ and CD8+ in the CD45+CD3+ gate; the percentage of CD11b+F4/80+ cells in the CD45+ gate as well as the percentage of CD11b+/F4/80+/CD206+ cells in the CD45+ gate were measured. Data represent the average ± SEM from six to eight mice per group. *Significant for P < 0.05. SSC, side-scattered plot.
