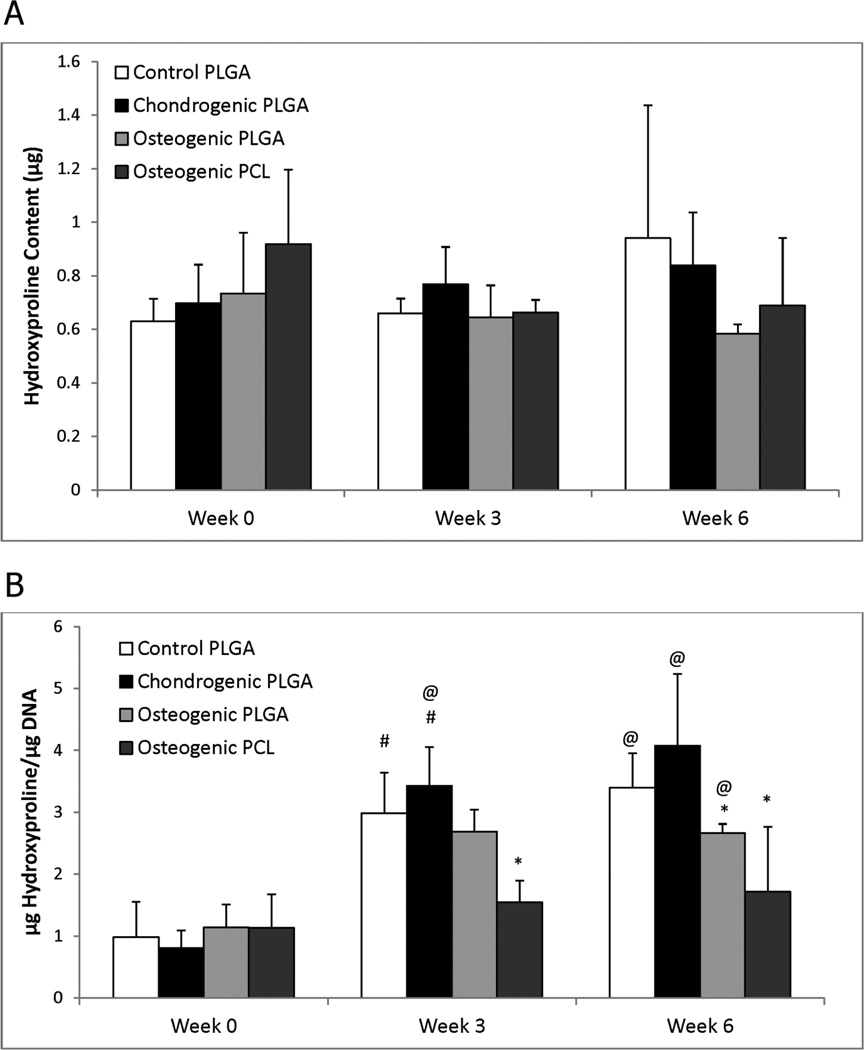
Figure 4.
Hydroxyproline (HYP) content for all groups, (A) per construct and (B) normalized to DNA content. (A) Statistically significant differences in HYP content were not observed. (B) All groups had statistically significant increases in HYP/DNA content at week 3 and 6 relative to week 0. There were no statistically significant differences between the two osteogenic groups at any time point. Values are reported as mean ± standard deviation, n = 4. Statistically significant difference @ = from the Control PLGA group at week 0 (p < 0.05), # = from its value at the previous time point (p < 0.05), and * = from the Control PLGA group at that time point (p < 0.05).

