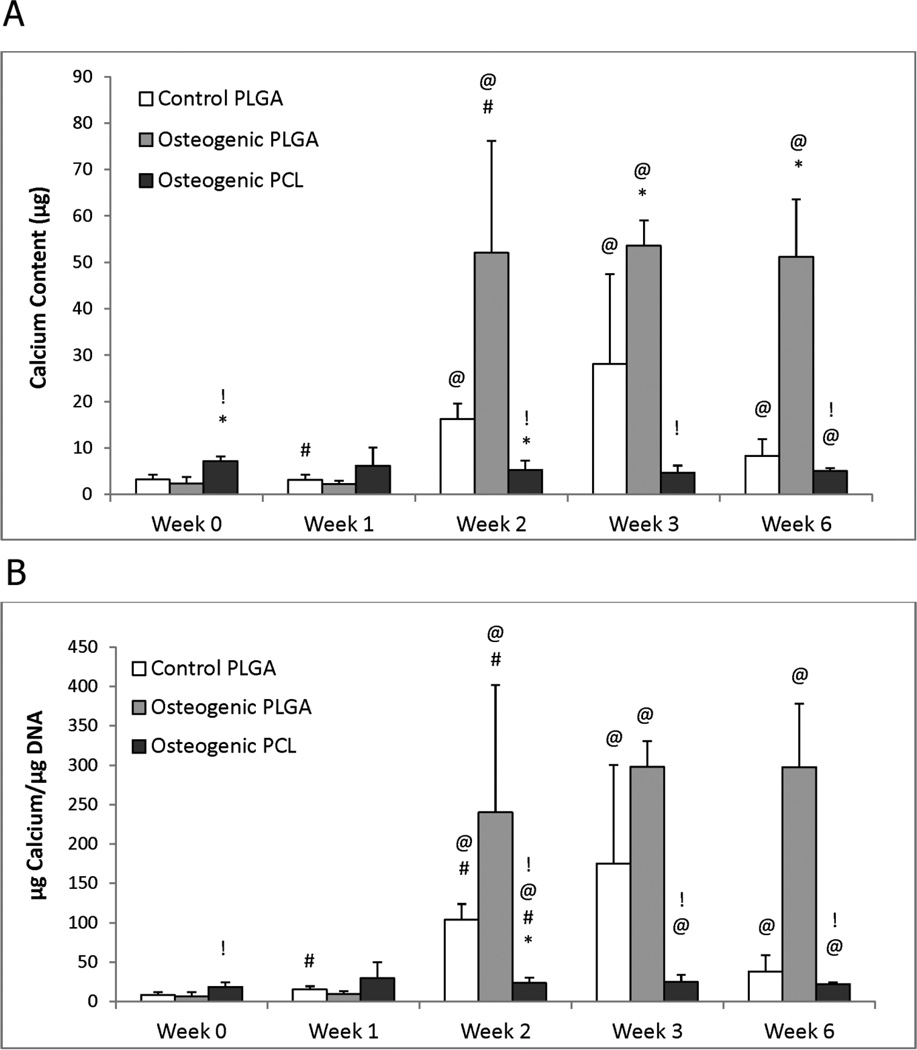
Figure 5.
Calcium content for the osteogenic groups, (A) per construct and (B) normalized to DNA content. (A) Most groups had statistically significant increases in calcium content from week 0 to week 6, but only the Osteogenic PLGA constructs had significantly higher production relative to the control at 6 weeks. Notably, this value was at least 6 times higher than any other group at the end of the culture. At 6 weeks, the Osteogenic PCL group showed a lower calcium content when compared to the Control group. (B) Osteogenic PLGA constructs produced more Calcium/DNA than Control and PCL groups at week 6. An continuously increasing Calcium/DNA content trend was observed for Control and Osteogenic PCL groups until week 3, although both decreased from week 3 to week 6. Values are reported as mean ± standard deviation, n = 4. Statistically significant difference @ = from the Control PLGA group at week 0 (p < 0.05), # = from its value at the previous time point (p < 0.05), * = from the Control PLGA group at that time point (p < 0.05) and ! = between the two osteogenic groups at that time point (p < 0.05).

