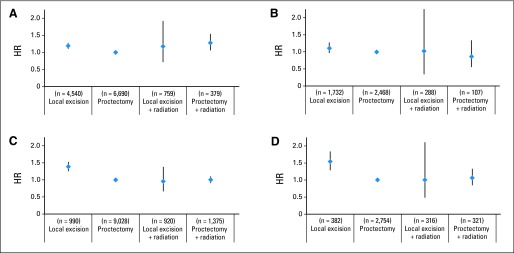
Fig 4.

Adjusted overall survival by treatment group for T1N0 tumors from (A) 1998 to 2005 (n = 11,528) and (B) 2003 to 2005 (includes comorbidity adjustment; n = 4,295) and for T2N0 tumors from (C) 1998 to 2005 (n = 11,564) and (D) 2003 to 2005 (includes comorbidity adjustment; n = 3,545). HR, hazard ratio.
