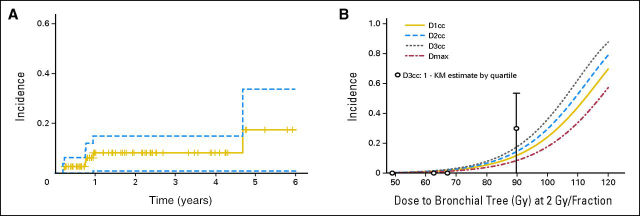
Fig 2.
(A) Incidence (1 − Kaplan-Meier [KM] estimate) of any grade 4 or 5 toxicity in patients censored at the time of death or last clinical follow-up. Dashed lines represent the 95% CI. (B) Two-year probabilities of late grade 4 or 5 toxicity according to dose-per-fraction normalized dose (EQD2) to the proximal bronchial tree and estimated using a Cox proportional hazards model. Open circles represent the 1 − KM estimate (± 95% CI) for quartiles of EQD2 D3cc (centered at the quartile mean). DXcc, maximum dose D such that X cm3 of the structure received a dose ≥ D; Dmax, maximum dose to any voxel within structure.

